
February 9, 2022
Emerging Trends and Enduring Patterns in American Family Life
Acknowledgments
The Survey Center on American Life of the American Enterprise Institute is grateful to the John S. and James L. Knight Foundation for its generous support of the American National Family Life Survey.
In addition, the authors would like to thank Beatrice Lee, Dana Popky, and Grace Burns for their research assistance and support with the design of the report figures; Sarah Burns and Josh Delk for their strategic insights and communications support; Abigail Guidera for her detailed oversight and administrative assistance; Rachel Hershberger for her careful and efficient editing; and Danielle Curran and Jennifer Morretta for their design and aesthetic expertise.
Executive Summary
American family life has profoundly changed over the past half century. The marriage rate is falling, women are having fewer children, and many Americans, young adults in particular, are rethinking what it means to be a family. But despite these changes, few Americans say the institution of marriage is outdated, and it remains a goal for most single Americans, who express interest in getting married one day.
The institution of marriage is evolving in important ways. Religion, which at one time was at the center of much of American family and married life, has become less prominent. Not only are interfaith unions increasingly common, so are marriages among people who have no religion. For couples married before 1972, roughly eight in 10 (81 percent) share the same faith as their partner, and just 3 percent are in secular marriages. In contrast, just over half (52 percent) of couples married in the past decade are in same-faith marriages, while 16 percent are in secular unions.
Americans still report high levels of satisfaction in their relationship with their spouse, and the social benefits of marriage remain considerable. The overwhelming number of married Americans have a positive view about their relationship with their spouse. Compared to Americans who are unmarried, married Americans are more likely to report that they have a satisfying social life and a larger group of close friends. They also say they are more satisfied with their personal health than their single peers do. Yet men appear to accrue these advantages at somewhat greater rates than women do. There is also a massive perception gap between men and women in the division of household labor. Women are far more likely than men to say they take on the lion’s share of domestic tasks, and mothers in particular say they do this when making decisions regarding their children.
The contours of American family life have changed considerably in recent years, but some of our most important formative influences remain the same. Most Americans report growing up with a sibling, and few experiences have a more unique or enduring impact than sibling relationships. Most Americans with siblings say they had a reasonably close relationship with their brothers and sisters growing up, and middle children notably report the closest relationships. Parental favoritism appears to exert a crucial role in how Americans relate to their siblings and broader feelings of social connection and kinship. Overall, 40 percent of Americans who grew up with siblings report that their parents had a favorite child. Americans who perceived their parents picked favorites feel less close to their siblings and their parents and were more likely to report feeling lonely while growing up than those who said their parents had no favorites report.
Introduction
The American family has never been a static institution. Rather, the patterns of family formation and function continue to evolve in response to the emergence of new technologies infiltrating American homes, shifting economic realities, and new cultural attitudes. Today, Americans are marrying later and having smaller families.[1] And more Americans than ever are choosing to elide either.
Despite these shifts in behavior, most young Americans still aspire to get married and have children. Few Americans report that marriage is irrelevant, and many believe that society benefits when its members prioritize having and raising children. However, how Americans think about marriage and child-rearing has changed. In their personal relationships, and even religion, Americans appear to be prioritizing individual preferences to a far greater extent.
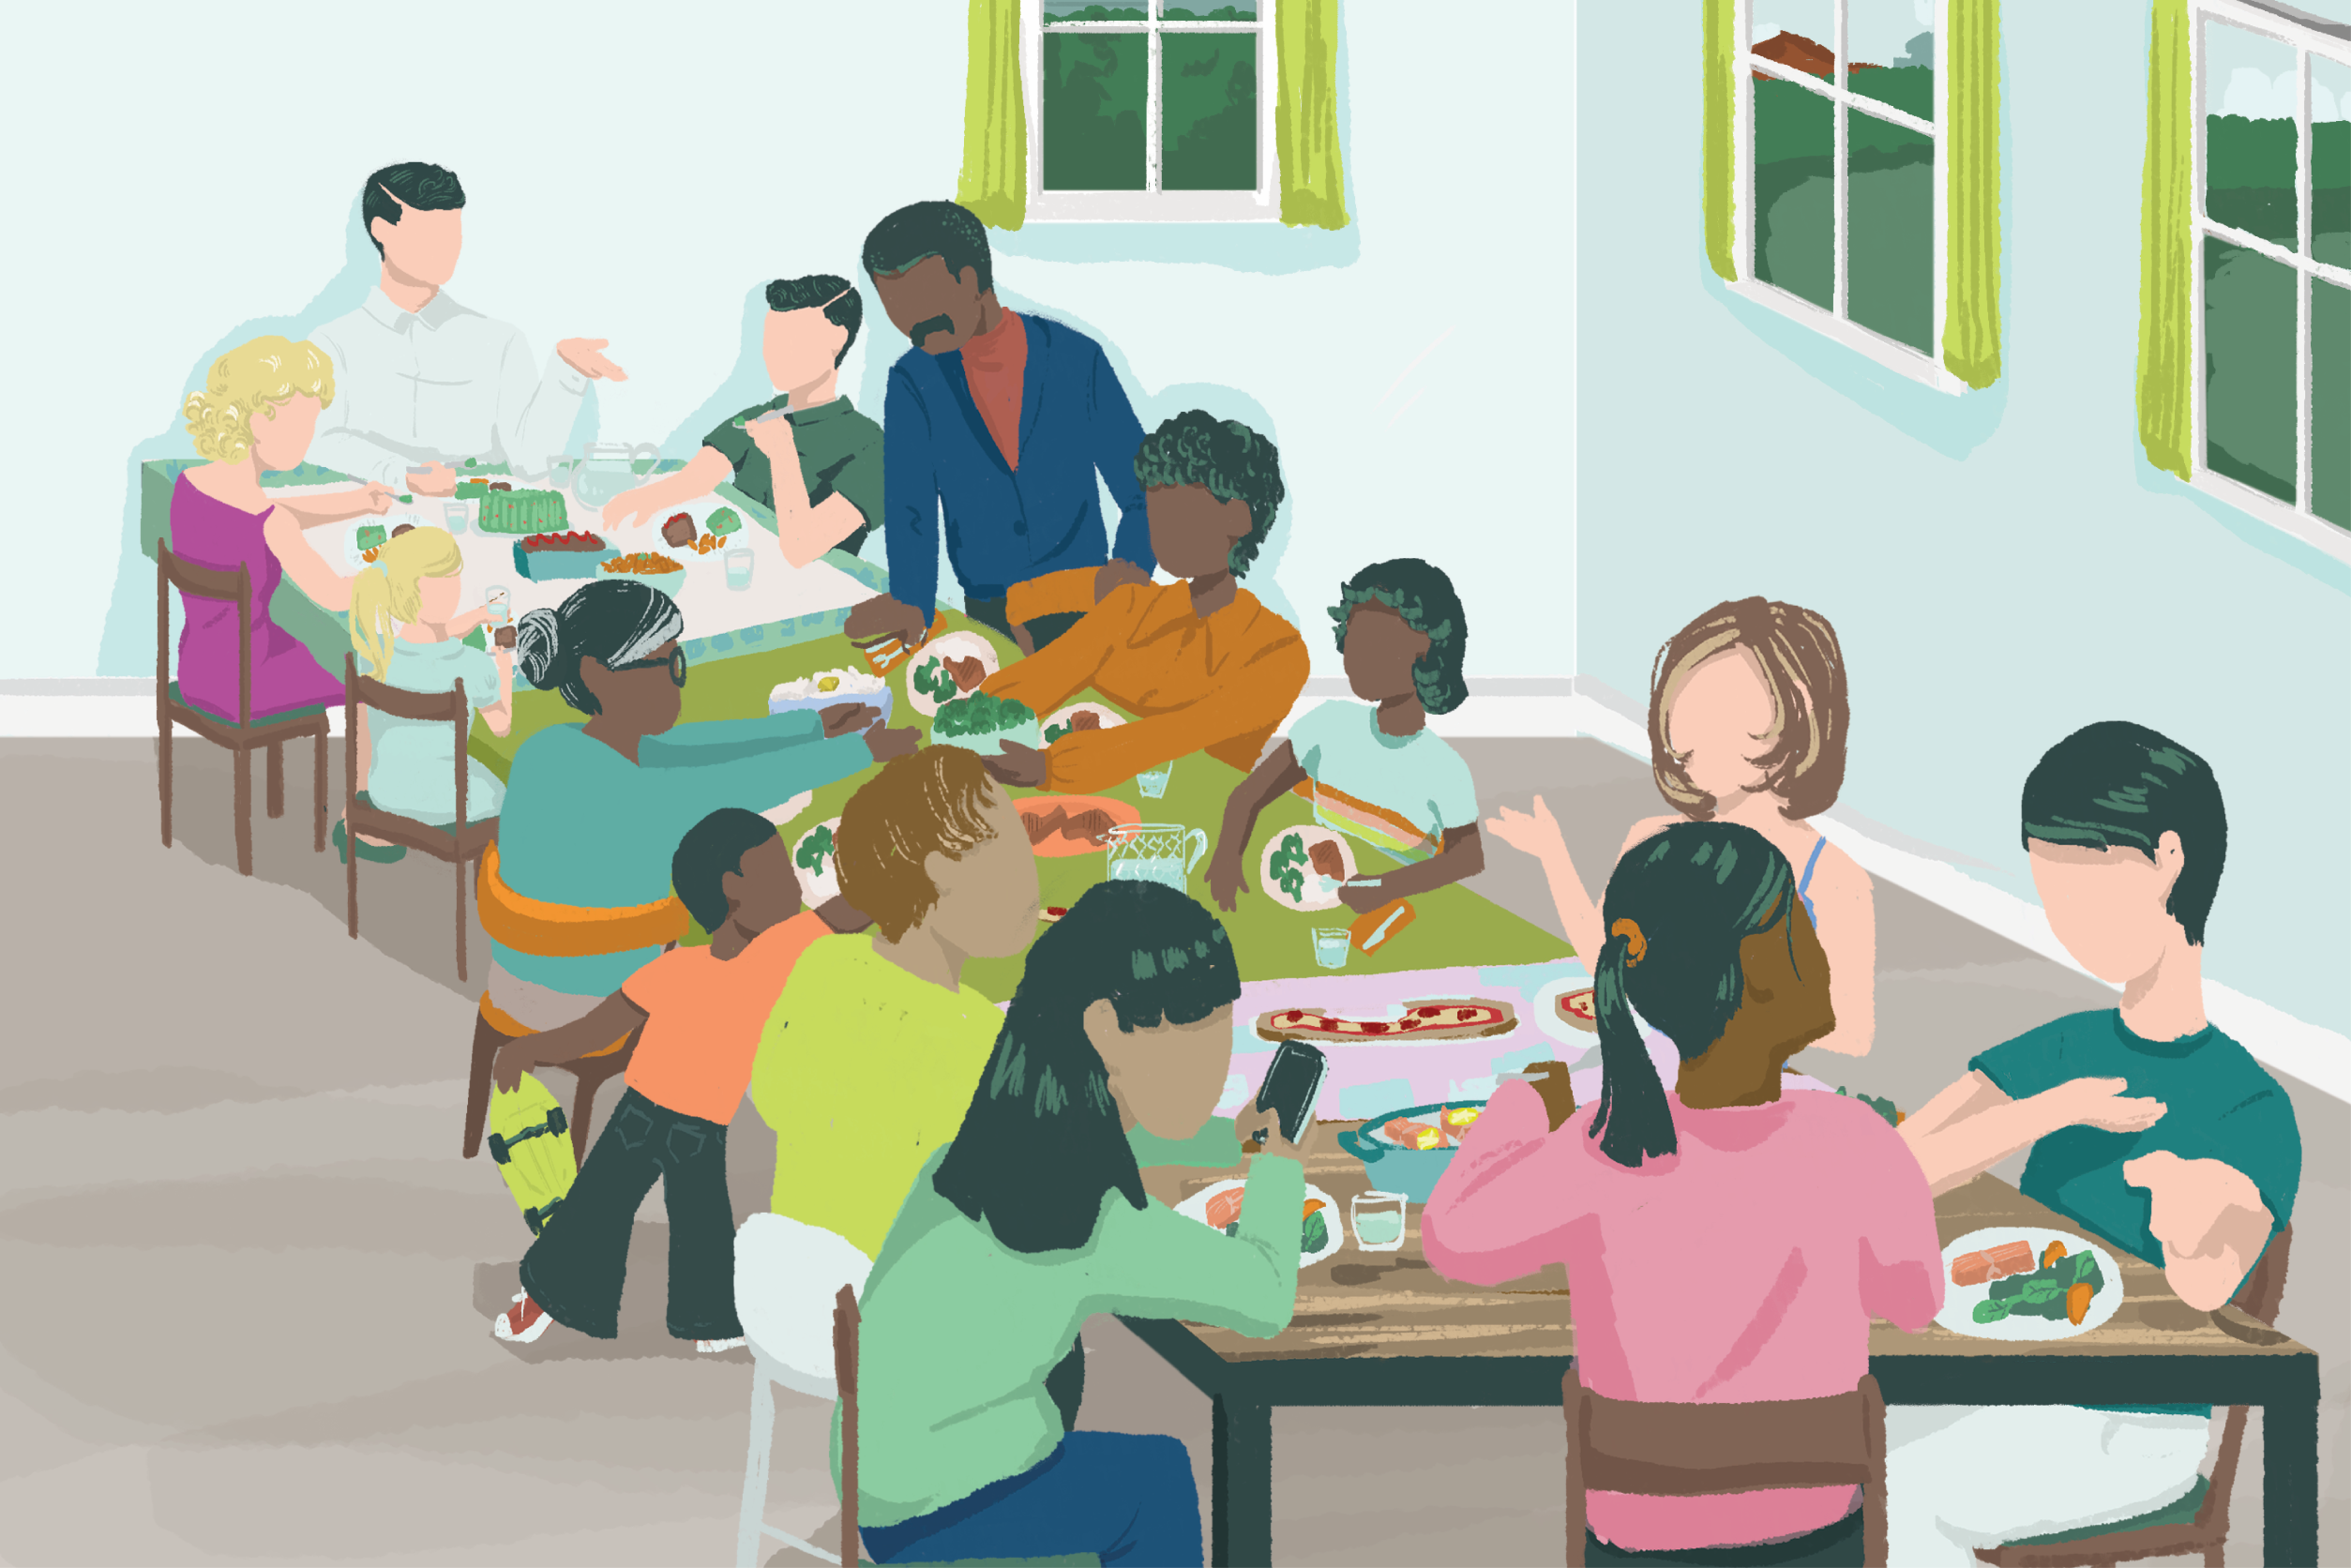
Newly married couples are eschewing religious wedding ceremonies that connect them to existing traditions and communities, preferring instead celebrations that reflect their own personal tastes and preferences. The primacy of individual preferences also manifests itself in family life. Fewer Americans growing up today have regular meals with their family, a practice that was routine a generation ago. And Generation Z reports having lonelier childhoods than those born in earlier generations.
But not all changes in family life are exclusively the culmination of shifting personal desires; the loss of faith in formative institutions, rising cost of childcare, and feelings of economic insecurity among young adults may play a role as well. There is evidence that the extensive financial obligation raising children requires is a formidable hurdle for many Americans. Americans who are uncertain about having children cite the cost of doing so as the most important reason they would choose not to do so.
Most Americans continue to be fairly upbeat about marriage—and for good reason. Both married men and women generally feel satisfied with their spouse. In aggregate, both men and women derive considerable benefit from being married. Married Americans have more satisfying social lives and larger social networks and report greater satisfaction in their personal health. Yet men appear to accrue these advantages at somewhat greater rates than women do.
Despite signs of greater parity between men and women in taking on domestic duties, women appear to take on a far greater burden, particularly with decisions regarding children. Women report performing far more of the household chores, including cooking, cleaning, and doing laundry. Married mothers are also far more likely to say they are primarily responsible for making health decisions and planning social activities for children. The ongoing tension may be one reason women are much more likely than men to leave their marriage and, after doing so, less likely to get married again.
But despite the many changes and distinct experiences, American family life has enduring qualities. In many families, mothers remain the most important source of personal and emotional support, although there are considerable cross-cultural variations. Our siblings continue to play a crucial role during our formative years and beyond. Parental decisions and behavior can have lifelong influence. Parental favoritism, the notion that parents have a favorite child, has far-reaching negative effects on family dynamics and relationships. And parental divorce continues to disrupt American family life.
Optimism About America’s Future
After nearly two years of life under a pandemic, economic upheaval, social disconnection, and political turmoil following the 2020 election, most Americans do not feel overly optimistic about how things are going in the country. Less than half of Americans report feeling very (6 percent) or somewhat (41 percent) optimistic about the country’s future. More than half (53 percent) say they feel pessimistic about where the country is headed.
There are massive racial differences in feelings of optimism about the country’s future. White Americans are far more pessimistic about the future than Black, Hispanic, and Asian Americans are. Black Americans are among the most optimistic about the direction the US is headed. Nearly two-thirds (64 percent) of Black Americans report feeling at least somewhat optimistic, as do 59 percent of Asian Americans and 55 percent of Hispanics. Only 41 percent of White Americans share this feeling of optimism about the future of the country. Six in 10 (60 percent) White Americans report feeling pessimistic.
No group expresses greater pessimism about the future of the country than White evangelical Protestants. Only one in three (33 percent) White evangelical Protestants say they feel at least somewhat optimistic about America’s future, while two-thirds (66 percent) feel pessimistic.
Short-Term Pessimists vs. Long-View Optimists
In thinking about the country’s trajectory, far more Americans believe things are getting worse rather than getting better. Nearly three-quarters (74 percent) of Americans say things in the US have mostly been getting worse, while 26 percent say that things in the country have generally been improving.
Optimists and pessimists think differently about how the country has changed. Americans who are optimistic about how things are going generally focus on the long arc of history, while those who express pessimism are more focused on recent events. The vast majority (90 percent) of Americans who say things are generally getting better in the US say this is happening slowly over time. Conversely, the majority (61 percent) of those who say things have been getting worse believe it is happening very quickly.
Community Satisfaction
Despite widespread negative views about the state of the country and its future, Americans are largely satisfied with how things are going in their own communities. More than eight in 10 (87 percent) Americans report feeling at least somewhat satisfied about the quality of life in their local community, although less than half (45 percent) say they feel very or completely satisfied. Only 14 percent of the public say they are not satisfied with the quality of life in their community.
Marriage, Children, and Family Life
The structure of American family life has undergone profound changes over the past half century. The nuclear family, which at one point served as the unchallenged cultural ideal, has slowly been replaced with a more diverse set of social arrangements.[2] While there was no one cause for this shift, a number of cultural, economic, and social changes helped bring about the rise of a more varied family structure.
First, there is the rise of single-parent households. A generation ago, the overwhelming majority of children were raised in two-parent households, but fewer children are raised in this type of household today.[3] Divorce and remarriage have become much more common even as the divorce rate peaked several decades ago.[4] Four in 10 (40 percent) marriages end in divorce, and remarriage is common, particularly among men, which frequently results in the creation of blended families.[5] As a recent report by the Pew Research Center notes, “As a result of these changes, there is no longer one dominant family form in the U.S.”[6]
One of the most important changes in American family life has likely been brought about by the decline in marriage. Over the past several decades, the marriage rate in the US has plummeted. According to an analysis from Pew Research Center, just over half (53 percent) of 25- to 54-year-olds are married—a 14 percentage point drop since 1990.[7]
Attitudes About Marriage
Despite waning participation, few Americans believe that marriage is irrelevant today. Only about one in four (26 percent) Americans believe marriage has become old-fashioned and out-of-date. Nearly three-quarters (74 percent) of the public disagree.
What’s more, these views are widely shared among the public. Although young adults today are less likely to be married than previous generations at their age were, their views of marriage roughly mirror those of the public overall.[8] Seventy-one percent of young adults (age 18 to 29) reject the notion that marriage has become old-fashioned and irrelevant—a view shared by 77 percent of seniors (age 65 and older). Views are consistent among men and women as well. Nearly identical numbers of men (73 percent) and women (74 percent) reject the idea that marriage has become a dated institution.
Perhaps due to the historic association between marriage and religion, religiously unaffiliated Americans are among the most likely to believe marriage is old-fashioned and out-of-date. Thirty-six percent of religiously unaffiliated Americans believe marriage is an outmoded institution. This view is far less common among religious Americans. For instance, less than one in five Mormons (15 percent), Jews (15 percent), and White evangelical Protestants (14 percent) say marriage is out-of-date.
Single Americans Are Not Sold on Marriage
Despite a widely held belief that marriage is still a relevant institution in American society, many of those who have never been married remain skeptical or ambivalent about getting married themselves. More than one-third (34 percent) of Americans who have never been married say they have no intention of ever doing so. Roughly two-thirds (65 percent) of unmarried Americans report that they would be interested in getting married at some point in their lives.
There is even less interest in marriage among Americans who are single and have never been married—those not currently in a committed romantic relationship or living with a partner. Sixty-one percent of singles say they would be interested in getting married someday. Perhaps because marriage is difficult to think about in the abstract, Americans who are currently in relationships are much more likely to express an interest in getting married. Roughly three-quarters (76 percent) of those who are in a relationship but have never been married say they want to get married someday.
Among single Americans, interest in marriage varies surprisingly little. Single Americans without a college education are about as likely to express an interest in marriage as those who graduated with a four-year degree (61 percent vs. 60 percent, respectively). Single men (60 percent) and women (62 percent) also report nearly equal interest in marriage. The one exception to this pattern is religion. Only half (50 percent) of religiously unaffiliated singles report being interested in getting married someday, compared to two-thirds (66 percent) of Christian singles.
Interest in marriage among Americans who have never been married also appears to diminish with age. While about three-quarters (76 percent) of young singles (age 18-29) report that they would like to get married one day, this aspiration is shared by fewer 30- to 49-year-olds (56 percent) and singles age 50 or older (39 percent).
Societal and Family Pressure
Few Americans say they feel pressured by society to get married. Among Americans who are currently single and have never been married, only 29 percent report they feel pressure from society to get married. Looking back, married Americans are about as likely to say the same, with 31 percent reporting that they felt pressure from society to get married. However, there is a notable gender difference among Americans who are already married in the amount of pressure they felt. Married women are more likely than married men to report feeling societal pressure (36 percent vs. 24 percent, respectively).
Americans report facing even less pressure from their families. Less than one in five (19 percent) Americans who have never been married, including similar numbers of women (21 percent) and men (18 percent), say they have experienced at least some pressure from family members to get married. The vast majority (80 percent) of adults who have never been married report they have not.
Disparities in Domestic Labor
A long-standing source of tension in many households is the division of household labor. There is a massive perception gap, with women far more likely than men to say they are engaged in a variety of domestic activities, such as cleaning, cooking, and doing laundry.
Among women who are currently married or living with their partner, a majority say they clean the house (65 percent), do the laundry (67 percent), or cook meals (63 percent) more often than their spouse or partner does. But differential perceptions of labor are not just limited to everyday chores. Women are more than twice as likely as men to report that they plan social activities and outings more often than their spouses do (51 percent vs. 18 percent). Men and women are about equally likely to say they usually pay bills and track household spending (52 percent vs. 54 percent), and in most households, both men (68 percent) and women (63 percent) say that their spouse or partner puts in equal effort in solving relationship problems, rather than leaving it primarily to one person. The only activities men report doing more of than their partners are yardwork and home repairs. Seventy percent of men say they do this type of work more often than their spouse does, compared to 14 percent of women who say they do this more often.
The disparity in domestic workload is particularly acute among families with children living at home. Mothers report being much more involved than fathers in activities relating to their children’s health, whether it includes scheduling doctor’s appointments or making health decisions for children. Seventy-nine percent of mothers say they are more often scheduling doctor’s appointments or making health decisions for children. Only 17 percent of fathers say they engage in these activities more often than their spouse or partner does. Mothers are also far more likely to take on scheduling responsibilities for their children. Nearly seven in 10 (69 percent) mothers say scheduling playdates and coordinating social activities for their children are activities they do more often than their spouse does. Only 11 percent of fathers say the same.
Household Labor and Relationship Satisfaction
It would be understandable if perceptions of unequal household labor resulted in lower levels of relationship satisfaction. However, the story is more complicated. For the most part, women who say they take on the lion’s share of domestic duties are not any less satisfied with their relationship. Women who report doing much more of the laundry and cleaning than their spouse or partner report being about as their relationship as other women. What’s more, this pattern holds regardless of women’s employment status.
Cooking appears to be the outlier in domestic duties. Women who report that they do more of the cooking report being less satisfied in their relationship than women who say this work is more evenly divided or a task their spouse does more often. Sixty-six percent of women who report that they do much more of the cooking say they are satisfied with their relationship, compared to 75 percent of other women. Similarly, women who do most of the yardwork and home repairs are much less satisfied with their relationship than other women are (51 percent vs. 71 percent).
For men, the relationship between division of household labor and relationship satisfaction is somewhat different. Men who report doing much more of the cooking and laundry are not any more satisfied than other men are. However, men who report doing much more of the house cleaning are significantly less satisfied in their relationships than men who say their spouse does this type of work more often or they do it roughly equally (65 percent vs. 79 percent).
Religious, Secular, and Interreligious Marriages
The American religious landscape has undergone a remarkable transformation over the past several decades. The number of Americans who are religiously unaffiliated has increased nearly sixfold over the past three decades, and Christian identity has plummeted.[9] The number of Americans belonging to non-Christian traditions, while modest in comparison, has risen dramatically.
These changes have profoundly affected the religious character of American marriages. Today, a majority (59 percent) of married Americans report having a spouse with the same religious affiliation.[10] More than one-quarter of married Americans are in an interfaith marriage (14 percent)—a union between people who have different religious traditions—or a religious-secular marriage (14 percent), in which one person identifies with a religious tradition and the other does not. Secular marriages, in which both people are religiously unaffiliated, have become increasingly common; 12 percent of marriages are among people who are both not religious.
Fifty years ago, same-faith marriages dominated the religious landscape. Over eight in 10 (81 percent) couples married before 1972 share the same religious affiliation with their spouse. More recent marriages reveal a distinctly different pattern. Among Americans married in the past decade, just over half (52 percent) are among couples who belong to the same religious tradition. More recent marriages are also far more likely to be among couples who are both secular. Only 3 percent of couples married before 1972 are in secular marriages, compared to 16 percent of couples married in the past decade.
No religious group is more likely to marry within their faith tradition than Mormons. Nearly nine in 10 (87 percent) Mormons report their spouse is also Mormon. Rates of religious homogamy are also high among Protestant religious traditions. Eighty-three percent of evangelical Protestants and about seven in 10 (72 percent) mainline Protestants report having a spouse of the same religion. A majority of Catholics (65 percent) and Jews (59 percent) also say their spouse shares their religious affiliation.
One of the most important shifts in American marriages is the rise of secular unions—marriages between couples who are not religious. Roughly six in 10 (62 percent) unaffiliated Americans have spouses who are also unaffiliated. This represents a dramatic increase from previous generations. In the 1970s, only 37 percent of Americans who were religiously unaffiliated reported having a secular spouse.
How Religious, Secular, and Interreligious Marriages Affect Belief, Belonging, and Behavior
Although interfaith unions have become more common, they are associated with overall lower levels of religious commitment. Americans in religiously mixed marriages demonstrate less religious engagement than those in same-religion relationships.
Americans in religiously mixed marriages are far less likely to attend services regularly than those married to someone who has the same religious commitments. Forty-four percent of Americans with a spouse who shares their religious affiliation attend services at least once a week. In contrast, 16 percent of Americans in interfaith marriages attend formal worships services weekly or more often, while just 1 percent of Americans in secular marriages—in which neither person identifies with a religious tradition—report attending weekly services. More than eight in 10 (81 percent) Americans in secular marriages say they never attend religious services.
Formal religious membership is also less common among those in interfaith marriages. A majority (61 percent) of Americans with a spouse who shares their religious affiliation say they are a member of a church or religious organization, compared to roughly a third (36 percent) of religious Americans whose spouse has a different religious background. Similarly, more Americans in religiously homogenous marriages (30 percent) say they are members of a prayer or bible study group, compared to 12 percent of religious Americans in interfaith marriages.
However, religious Americans in interfaith marriages are not much more likely to express religious doubts. Only 19 percent of religious Americans in religiously mixed marriages and 13 percent of those married to someone who shares their religion report they sometimes doubt whether God exists.
One possible explanation for the discrepancy in religious involvement is that people who enter interfaith relationships simply care about religion less. As a result, Americans in religiously mixed marriages may not have prioritized religious compatibility when selecting a spouse. However, the formative religious experiences—which strongly predict adult religiosity—of Americans in interfaith marriages and those in same-religion marriages are similar. For instance, equal numbers of religious Americans married to someone who shares their religion (58 percent) and those whose spouse has a different religious background (58 percent) say they attended worship services at least once a week growing up. The two groups also have comparable levels of formative religious engagement when it comes to participating in religious education programs during their childhood.
Marriage Ceremonies and Marital Satisfaction
Religious marriage ceremonies were once the norm in the US, but they have become increasingly less common. Among Americans who are married today, less than half (46 percent) say they were married by a religious leader in a church or other religious setting. Sixteen percent say they were married by a religious leader in a secular setting, and more than one-third (36 percent) report having an entirely secular service—taking place in a nonreligious setting and officiated by a nonreligious figure, either a justice of the peace, friend, or family member.
More recent marriages are much more likely to take place in secular settings and be officiated by nonreligious figures. Only 30 percent of Americans who were married within the past decade report having their ceremony in a church, house of worship, or other religious location and officiated by a religious leader. In stark contrast, more than seven in 10 (72 percent) Americans who were married at least 40 years ago report having an entirely religious service—at a religious location and with a religious leader presiding. Nearly half (49 percent) of marriages that took place within the past decade were secular services.
In part, the rise of secular marriage ceremonies is likely explained by the increasing number of secular couples getting married. A majority (58 percent) of Americans who say their partner shares their religious affiliation were married by a religious leader in a religious setting. Thirty-seven percent of Americans in interfaith marriages also describe the setting this way, but only 19 percent of secular couples opt for a religious service. More than six in 10 secular marriages took place in a nonreligious setting and were officiated by a justice of the peace (41 percent) or friend or family member (22 percent).
Overall, most Americans express a high degree of marital satisfaction, regardless of their spouse’s religious identity. However, secular couples are less likely to say they are completely satisfied. Forty-four percent of religious Americans whose spouse shares the same religion say they are completely satisfied with their relationship, compared to 32 percent of unaffiliated Americans who have a nonreligious spouse. Intriguingly, religious Americans who are married to someone who is not religious are far more likely to report being completely satisfied with their relationship than are nonreligious Americans who have a religious spouse (47 percent vs. 28 percent, respectively).
Politically Mixed Marriages
While interfaith marriages in the United States are on the rise, politically mixed marriages remain uncommon. One in five (20 percent) Americans have a spouse whose political affiliation differs from their own.[11] The vast majority (80 percent) of Americans are married to people who share their same basic political orientation.
The degree of political diversity in marriages is nearly identical among Democrats and Republicans. Only 17 percent of Democrats and 16 percent of Republicans report having a spouse who has a political identity different from their own. In contrast, about four in 10 (39 percent) political independents say their spouse has a political identity different from theirs.
Americans who identify as politically moderate are also more likely to have marriages that cross the political aisle. Moderates (28 percent) are twice as likely as both liberals (14 percent) and conservatives (14 percent) to report their spouse’s political identity is distinct.
Unlike interfaith marriages, which have become more common in recent years, the prevalence of politically mixed marriages is more stable. Thirteen percent of couples married before 1972 have dissimilar political affiliations, compared to 21 percent of those married in the past decade.
Marital Satisfaction
Having a spouse who does not share the same political orientation may lead to somewhat reduced feelings of relationship satisfaction. Republicans in mixed marriages are less likely to be very or completely satisfied in their relationship than are those married to people aligned with their politics (86 percent vs. 75 percent). There is a more pronounced gap in feeling completely satisfied. Republicans married to politically similar spouses are much more likely than those in politically mixed marriages to say they feel completely satisfied with their relationship (49 percent vs. 34 percent). Democrats married to someone who shares their politics also report greater relationship satisfaction; 74 percent of Democrats whose spouse has similar political views say they are very or completely satisfied, compared to 67 percent in politically mixed marriages.
Politically Mixed Marriages and Moderation
Being in a politically mixed marriage is associated with having less extreme political views and partisan hostility. Two-thirds (66 percent) of Democrats with a Democratic spouse say they have a very unfavorable view of the Republican Party, compared to 34 percent of Democrats in mixed marriages. Similarly, three-quarters (73 percent) of Republicans in politically homogenous marriages say they have a very unfavorable view of the Democratic Party, while less than half (46 percent) of those who have a spouse who does not share the same politics have a very negative view of the Democratic Party.
Politically mixed marriages may also soften Republicans’ views of opposing party leadership. Republicans married to other Republicans express a much more negative opinion of Joe Biden than those whose spouses have somewhat different political views (82 percent vs. 54 percent, respectively). Notably, for Democrats, negative views of Donald Trump appear to transcend marital influence. Democrats in mixed marriages are not much less likely than those in politically aligned marriages to say they have a very unfavorable view of Trump (73 percent vs. 87 percent).
Divorce, Remarriage, and the Benefits of Marriage
In the US today, divorce remains an all-too-common destination for many marriages. Forty percent of Americans who were ever married report having gotten a divorce. However, the divorce rate, which peaked in the early 1980s, has gradually declined ever since.
Consistent with recent published work, divorce is more common among Americans without a college education.[12] Among Americans who have ever been married, 30 percent of those with a college degree report they have ever been divorced. Forty-six percent of Americans without a college degree say the same.
There is little evidence that religiosity leads to lower rates of divorce. Among Americans who have ever gotten married, rates of divorce are fairly similar across religious traditions. About four in 10 (41 percent) religiously unaffiliated Americans have gotten divorced, similar to the rate of White Catholics (35 percent), Jewish Americans (37 percent), White evangelical Protestants (37 percent), and Hispanic Catholics (39 percent). White mainline Protestants (44 percent) and Black Protestants (50 percent) report somewhat higher divorce rates than other religious traditions. Mormons stand out for their relatively low rates of divorce; only 27 percent of Mormons who were ever married have gotten divorced.
Women continue to initiate divorces at far higher rates than men do. Although a majority of Americans who have gone through a divorce perceive that they were the ones pushing for it, women report making the decision much more frequently than men do. Two-thirds (66 percent) of divorced women say it was their decision to end the marriage. Twelve percent say their former spouse made the decision, and about one in five (21 percent) say the decision was made jointly. Among divorced men, only 39 percent say it was their decision, while most say it was either their former partner’s decision (31 percent) or the decision was made jointly (30 percent).
For women, higher income appears to increase the likelihood of initiating divorce. Over three-quarters (77 percent) of women making over $100,000 a year say they decided to divorce. Although still making up a majority, women making less than $25,000 are roughly 10 percentage points less likely (68 percent) to say they initiated their divorce. Income appears to play an opposite role for men, with wealthier men less likely to seek divorce than men with lower incomes are.
Ending a marriage can be emotionally difficult, financially costly, and socially disruptive. Despite this, few Americans who have gone through the process express regret. Nearly nine in 10 (88 percent) Americans who have been divorced report that they feel they are better off than they would have been if they stayed married. Eleven percent say things would be better for them if they had remained married.
Does Parental Divorce Increase the Likelihood of Failed Marriages? There is little evidence that being raised by divorced parents greatly increases one’s likelihood of divorce or reduces one’s interest in marriage. Americans who report their parents were divorced during most of their childhood are slightly more likely to get divorced themselves compared to those whose parents remained married (45 percent vs. 39 percent). Further, unmarried adults under age 40 who were raised by married parents express nearly identical interest in marriage as those raised by parents who were divorced do (76 percent vs. 75 percent). Finally, controlling for demographic characteristics, such as race and ethnicity, educational background, household income, gender, and religious affiliation, the marital status of parents is not a significant predictor of marriage interest or divorce rates.
Relationships, Remarriage, and Marital Benefits.
Perhaps because men are more likely to experience involuntary divorce, or at least a marital dissolution that they were less involved in initiating, men are far more likely to get remarried. Among Americans who have ever gotten divorced, men are much more likely than women to be remarried (51 percent vs. 33 percent). What’s more, nearly three-quarters (73 percent) of women who have gotten a divorce and are now single express no interest in marrying again.
Compared to men, women who have gone through a divorce are less likely than men to reenter a romantic relationship. Forty-four percent of women who have been divorced and who have not remarried report they are single, compared to 27 percent of men.
Who Benefits More from Marriage?
Another possible explanation for why men are less likely to initiate divorce and are more likely to remarry is that they seem to benefit more from the arrangement than women do. Married men are far more likely than single men to report being very or completely satisfied with their social lives (52 percent vs. 30 percent).[13] They also have a larger number of close friends; single men are three times as likely as married men to say they have no close friends (15 percent vs. 5 percent). Married men report being more satisfied with their personal health than single men do (49 percent vs. 34 percent). Finally, married men are far less likely to report feeling lonely or socially isolated than single men are. Married men (56 percent) are more than twice as likely as single men (25 percent) to say they hardly ever or never feel lonely or isolated from the people around them.
Women benefit from marriage as well, but their relative gains are more modest. Less than half of married women (48 percent) report being very or completely satisfied with their social life, compared to 33 percent of single women. Forty-six percent of married women are satisfied with their personal health, compared to 35 percent of single women. There is also a more modest gap in feelings of loneliness. Nearly half (48 percent) of married women report they do not feel lonely or socially isolated, while 30 percent of single women say the same.
Behind the Baby Bust
The US birth rate reached a record low in 2020.[14] A recent Brookings Institution report notes that births have been “falling almost continuously for more than a decade.”[15] Evidence shows that the pandemic may have encouraged couples to postpone having children, which may result in a rebound as these challenges and uncertainties recede. But questions remain as to how the experience of the pandemic, and the attendant social and economic challenges, may have permanently altered how Americans think about parenthood and prioritize child-rearing.
Although most Americans have a positive view about marriage, there is considerable skepticism about the societal benefits that marriage and parenthood confer. Overall, roughly six in 10 (62 percent) Americans believe society is just as well off if people have priorities other than getting married and having children. Thirty-seven percent say society benefits when people make marriage and child-rearing priorities.
Younger Americans are least likely to see the societal value in marriage and parenthood. Forty-four percent of seniors (age 65 or older) say a society that prioritizes marriage and child-rearing is better off, while only one-quarter (25 percent) of young adults (age 18 to 29) say the same. Roughly three-quarters (74 percent) of young adults believe society is just as well off if people have other goals.
The generation gap is even larger among men. Senior men are about twice as likely as young men to say that society is better off when marriage and child-rearing are priorities (51 percent vs. 26 percent).
Liberals and conservatives are sharply at odds over the societal importance of family formation. A majority (57 percent) of conservatives believe society is better off when marriage and child-rearing are priorities, a view shared by only 19 percent of liberals.
The generational shift in attitudes cuts across ideology but is far larger among conservatives. Older liberals are somewhat more likely than young liberals to embrace the notion that society benefits when getting married and having children are priorities (23 percent vs. 15 percent). Large majorities of both age groups reject this idea. In contrast, older conservatives are far more likely than young conservatives to believe in the societal benefit of people prioritizing marriage and children (64 percent vs. 37 percent).
Who Does and Does Not Want Children? And Why?
Although young adults are not convinced of the societal benefit of prioritizing family formation, most young people without children still express an interest in starting a family at some point. A majority (56 percent) of young adults without children say they would like to have them someday. Notably, young men (55 percent) are about as likely as young women (58 percent) to express interest in becoming parents.
Younger Americans (age 18 to 39) who are in a relationship are significantly more likely than those who are single to say they want to have children (57 percent vs. 45 percent). It may be that being in a committed relationship makes the prospect of having children feel less abstract. It’s also possible that those who are prioritizing starting a family are more likely to enter a committed relationship.
For young people who are uncertain about having children, one of the most common reasons cited is the cost. Close to one in four (23 percent) younger adults (age 18 to 39) without children who are uncertain about having children say cost is a crucial factor in their thinking. Seventeen percent say they worry they would not be a good parent. About one in four younger adults say having children would be too much work (17 percent) or interfere with their professional or educational goals (9 percent). Ten percent say their decision is based on concerns about climate change, environmental problems, or the state of the world. Less than one in 10 (9 percent) younger adults cite health concerns or age as the primary reason they would choose not to have children.
Marrying Later and Smaller Families
Today, Americans are settling down and starting families later than in generations past. In 2021, the median age for first marriage was 30.4 for men and 28.6 for women.[16] Roughly five decades earlier, in 1972, the median marital age was 20.9 for women and 23.3 for men. The average age of first-time mothers has risen as well. In 2016, the average age of first-time mothers was 26, up from 21 in 1972.[17] Americans who choose to marry later in life and postpone having children may also choose to have smaller families.
Although women who decide to have children later in life are often more emotionally prepared and have greater financial stability, they may also experience more frequent health and fertility challenges. For mothers who considered having more children but ultimately decided against it, age and health issues are the most oft-mentioned reasons. More than four in 10 mothers say they chose not to have another child because they thought they were too old (17 percent) or had a health problem that would make it difficult or impossible to have another child (24 percent). Eighteen percent of mothers say cost was the deciding factor, and 12 percent say their spouse’s lack of interest was the primary reason. Only 2 percent of mothers say the decision not to have more children was due to educational or career goals.
Americans who get married earlier also report having larger families.[18] But this is mostly true for women. Nearly half (48 percent) of women who were married in their teens or early 20s have at least three children. In contrast, only 37 percent of women who were married at age 30 or later say they have at least three children. More than six in 10 (63 percent) women married in their 30s or later report having two or fewer children. This relationship holds even after accounting for other factors that might predict family size, such as religious affiliation, race and ethnicity, educational attainment, and income—but only for women.[19] For men, marital age is not a significant predictor of overall family size once controlling for other demographic characteristics.
The Challenge of Raising Children
Most Americans, even those without children, harbor no illusions about the challenges of raising a child. Using a 10-point scale (with 10 representing “very difficult” and one indicating “very easy”), most (56 percent) Americans say that raising a child to be a good person is at least somewhat difficult—ranking it seven or greater. Fourteen percent say raising a child to be a good person is “very difficult,” the top rating on the scale. Only 20 percent of the public believe child-rearing is easy, ranking it between one and four.
Although most Americans believe raising children is difficult, fewer Americans say child-rearing is more difficult today than they did a couple decades earlier.[20] In 1998, 72 percent of the public said raising children was at least somewhat difficult, rating it seven or greater on an identical 10-point scale.
Americans who perceive raising children to be more difficult express more reservations about having them. Nearly half (47 percent) of Americans without children who perceive it to be easy to raise well-adjusted people (rating it a four or less on the scale) say they want to have children someday. In contrast, among those who say raising children is difficult (a seven or greater), only 28 percent say they are definitely interested in having children.
Few Americans believe it is possible to raise children today without making major personal sacrifices. Nearly three-quarters (73 percent) of the public believe having children requires making major personal sacrifices. Twenty-three percent say it requires only minor sacrifices, and 4 percent say it requires making no personal sacrifices at all.
Formative Family Experiences
One way in which American family life appears to have changed is in how often and what ways family members spend time together. A generation ago, family meals were routine. Roughly three-quarters of baby boomers (76 percent) and 84 percent of Americans who belong to the silent generation report that they had meals together as a family every day. Fifty-nine percent of Americans who belong to Generation X say they had daily meals with their family. In contrast, less than half of millennials (46 percent) and Generation Z (38 percent) report that growing up they had meals with their family every day.
Younger Americans also report having lonelier childhoods. Thirty-nine percent of Generation Z and 35 percent of millennials report that they felt lonely at least once a week growing up. Twenty-nine percent of Americans who are part of the Generation X cohort also say they felt lonely this often during their childhood. In contrast, only 17 percent of baby boomers and 11 percent of Americans who are part of the silent generation say they felt lonely at least once a week.
American families may also be getting more political. Politics appears to be discussed with more regularity among families today than it was a generation ago. Thirty-eight percent of Americans who belong to Generation Z say they talked about politics in their family at least once or twice a month. Only one-quarter (25 percent) of baby boomers and 20 percent of members of the silent generation say politics was a topic of discussion this often.
Sibling Relationships
Few aspects of childhood have a more unique or enduring impact than sibling relationships. Nearly eight in 10 Americans grew up with at least one sibling, making them a more ubiquitous presence in early life than fathers.[21] But the ubiquity of these relationships belies what is known about their influence. Much of the debate about the influence of siblings has often centered on birth order—whether someone was an eldest, youngest, or middle child. Recent work had discounted the influence that birth order has on personality.[22] Less attention has been devoted to understanding the way having siblings alters childhood experiences and how sibling relationships are themselves affected by family dynamics such as divorce and parental favoritism.
Most Americans with siblings report that they had at least a reasonably close relationship with their brothers and sisters growing up. Roughly eight in 10 Americans with siblings say they had a very close (41 percent) or somewhat close (37 percent) relationship with them. Twenty-two percent report they were not too close or not at all close with their siblings.
Birth order may play a role in the type of relationship siblings have with each other. Middle children are generally more likely to report having a close relationship with their siblings. Nearly half (48 percent) of middle children report having a very close relationship with their siblings, compared to 40 percent of eldest children and 35 percent of youngest children.
But other family dynamics may influence the contours of sibling relationships as well. The marital status of parents during formative years may also play a role in how close siblings feel to one another. Men who grew up with divorced parents report feeling more distant from their siblings compared to men whose parents were married report. Only 29 percent of men whose parents were divorced report having a very close relationship with their siblings growing up, compared to 41 percent of men whose parents were married for most of their childhood. The relationship women have with their siblings does not appear to be affected by parental divorce in the same way.
Although many Americans describe their relationship with their siblings as being at least somewhat close in childhood, only about half (51 percent) report being very or completely satisfied with the current relationship they have with their sibling or siblings. Thirty percent report that they are only somewhat satisfied, and 18 percent report being unsatisfied with their relationship.
Even among Americans who describe their childhood relationship as being very close, only about seven in 10 (69 percent) report being very or completely satisfied with the relationship they have with their siblings as an adult. Among those who describe their formative relationship as being “somewhat close,” less than half (46 percent) report being completely or very satisfied.
There is evidence that parents may play an important role in helping establish strong sibling connections. There is a strong correlation between how satisfied Americans are with the relationship they have with their parents and their siblings. Simply put, Americans who are very or completely satisfied with the relationship they have with their parents are very likely to feel the same about their relationship with their siblings.
Parental Favoritism
Parental favoritism—the perception that there was a favorite child in the family—may be an important factor influencing the quality of sibling relationships.
Many Americans who grew up with siblings believe their parents had a favorite child. Forty percent of Americans who grew up with siblings report that their parents had a favorite child. Sixty percent say they do not believe their parents had a favorite.
Women are more likely than men to perceive parental favoritism among siblings. Close to half (45 percent) of women compared to 35 percent of men say their parents had a favorite child.
Americans raised by divorced parents are more likely to believe their parents had a favorite than are those raised by parents who were married during their formative years. More than half (51 percent) of Americans who report their parents were divorced for most of their childhood believe their parents had a favorite child. Thirty-eight percent of Americans whose parents were married perceived their parents as having a favorite.
Who’s the Favorite?
Men are much more likely than women to report being the family favorite. One-third (33 percent) of men who believe their parents picked favorites say they were the favorite in their family. Less than one-quarter (23 percent) of women believe they were their parents’ favorite.
Youngest children are generally more likely to report that they were their parents’ favorite. This is particularly true of youngest boys. Overall, 38 percent of Americans who are the youngest in their family report they were the favorite, compared to 27 percent of those who were oldest. Middle children are the least likely to say they were a favorite child; only 20 percent believe they were. Forty-four percent of men who were youngest say they were the family favorite. Women who were middle children are least likely to believe they were a favorite child; only 17 percent report that they were.
The Negative Consequences of Favoritism
Past research has shown that parental favoritism can have lasting negative effects on relationships, personal self-esteem, and feelings of social connection.[23] Americans who grew up in families that perceived their parents had a favorite were much less close to their siblings when they were growing up than were those who do not believe their parents had a favorite child. Among those who believe their parents had a favorite child, only 30 percent say they were very close to their siblings growing up. In contrast, nearly half (48 percent) of Americans who were raised in households in which parents did not have a favorite child say they felt very close to their siblings.
But it’s not just sibling relationships that may be affected. Americans are far more likely to report having a positive relationship with their parents when they did not perceive them as having a preferred child. More than two-thirds (68 percent) of Americans who say their parents did not have a favorite child report being very or completely satisfied with the relationship they have or had with their parents. Less than half (47 percent) of Americans who believe their parents had a favorite report being satisfied with their relationship. Even Americans who believe they were the favorite do not report having as close a relationship with their parents as those who say their parents did not have a favorite child. Just 55 percent of favorite children are satisfied with their relationship with their parents.
What’s more, perception of parental favoritism may have an enduring effect on sibling relationships later in life. Even as adults, Americans who perceived that their parents had a favorite child are much less likely to report being satisfied with their sibling relationship than those who believe their parents did not pick favorites report. Fifty-eight percent of Americans who say their parents did not have a favorite child are very or completely satisfied with the relationship they have with their siblings today, compared to 42 percent of those who say their parents had a favorite.
Parental favoritism is also associated with childhood loneliness. Americans who report that their parents had a favorite child are far more likely to report that they felt lonely growing up. Forty percent of Americans who believe their parents had a favorite report feeling lonely at least once a week growing up, compared to 18 percent of those who believe their parents did not.
Being thought of as less preferred is strongly associated with educational expectations as well. More than half (51 percent) of Americans who report they were the favorite in their family say it was expected they would go to a four-year college. Less than one-third (32 percent) of those who say they were not the favorite report it was expected they would attend college.
Birth Order, Only Children, and Childhood Loneliness
Perhaps due to their relatively close relationship to other siblings, middle children report that they felt lonely less often growing up than other Americans report. Less than one-third (30 percent) of middle children report that they felt lonely growing up at least a couple times a month. Thirty-six percent of youngest children and 41 percent of oldest children report having felt lonely this often. Only children report feeling lonely much more frequently. Nearly half (49 percent) say growing up they felt lonely at least once or twice a month.
Women who say they are only children report having felt lonely much more often during their childhood than their male counterparts did. A majority (55 percent) of women who are only children say they felt lonely at least a couple times a month growing up, compared to 42 percent of men who are only children. Nearly three in 10 (29 percent) women who are only children say they felt lonely at least a couple times a week.
Although being an only child is associated with more frequent feelings of childhood loneliness, there is little evidence to suggest these experiences have much bearing on our social lives as adults. Only children report having roughly the same number of close friends as those who grew up with siblings and are just as satisfied with their social lives today.
Despite often feeling lonely growing up, there is some evidence that middle children experience the feeling of being overlooked or forgotten. Middle children are far less likely than their siblings or Americans who were only children to say their family expected them to attend a four-year college. A majority (54 percent) of only children and about half (48 percent) of eldest children report that growing up there was a family expectation that they would go to college. Forty-three percent of youngest children report that it was expected they would attend college, but only 35 percent of middle children say this.
Growing Up, Who Do Americans Turn to for Help? Mothers
When it comes to providing personal and emotional support, no person in Americans’ formative lives is more important than mothers. Forty-one percent of Americans report that growing up, the person they would turn to first when they had a problem was their mother. Twenty-two percent of Americans say they would first turn to a friend when facing a personal problem. Only 8 percent say their father was the person they would go to before anyone else. Eleven percent report that they would go to a sibling, and 6 percent say they had another family member who was their first line of support. More than one in 10 (11 percent) Americans say they did not have anyone they could turn to when they had a problem growing up.
Who Americans first turned to when they experienced a problem growing up varies along the lines of race and ethnicity, gender, and religion. Asian Americans (30 percent) are far less likely to say their mother was the first person they would turn to than Hispanic (39 percent), Black (42 percent), or White Americans (42 percent). In contrast, no group is more likely to turn to their mothers for help during their formative years than Black men. Close to half (46 percent) of Black men say their mother was the first person they would go to when they had a personal problem.
White women (27 percent) are more likely than White men (19 percent) to turn to friends growing up. White men are more than twice as likely as White women to say their father was the first person they would turn to with a problem (12 percent vs. 5 percent, respectively).
For Black and Hispanic women, siblings—especially sisters—seem uniquely important. Seventeen percent of Black women and 15 percent of Hispanic women say they would first turn to a sibling when they had a problem.[24] Asian Americans are most likely to report leaning on a close friend. Twenty-eight percent of Asian Americans say they relied most on a close friend when confronted with a problem.
No group is more likely to rely on their father for support during their childhood than White evangelical men. Seventeen percent of White evangelical men say their father was the person they would turn to first if they had a problem as a child. Only 6 percent of White evangelical women say the same. But White evangelical women are about twice as likely as men to say they would seek out help from a close friend before anyone else (27 percent vs. 14 percent).
Family Estrangement
Although American politics appears more contentious than ever, few Americans report that political differences have harmed their relationship with a family member. Only 11 percent of Americans report that they have stopped talking to a family member because of something they said about government and politics.
However, twice as many Americans report having become estranged from a family member over a disagreement about their personal opinions or beliefs. Twenty-two percent of Americans say they have stopped talking to a family member because their personal beliefs were offensive or hurtful.
Americans who identify as atheist or as gay, lesbian, or bisexual are far more likely to have become estranged from family members than other Americans have. More than one in three (35 percent) atheists and nearly four in 10 (38 percent) gay, lesbian, or bisexual Americans report having ceased talking to a family member because they found their views hurtful or offensive.
About the Author
Daniel A. Cox is a senior fellow in polling and public opinion at the American Enterprise Institute and the director of the Survey Center on American Life. He specializes in survey research, politics, youth culture and identity, and religion.
Survey Methodology
The survey was designed and conducted by the American Enterprise Institute. Interviews were conducted among a random sample of 5,030 adults (age 18 and older), with oversamples of respondents who identified as belonging to the Church of the Latter-Day Saints (Mormon) and Jewish respondents living in the United States, including all 50 states and the District of Columbia. Interviews were conducted both online using a self-administered design and by telephone using live interviewers. All interviews were conducted among participants using a probability-based panel designed to be representative of the national US adult population run by NORC at the University of Chicago. Interviewing was conducted between November 23 and December 14, 2021.
Weighting was accomplished in two separate stages. First, panel base weights were calculated for every household based on the probability of selection from the NORC National Frame, the sampling frame that is used to sample housing units for AmeriSpeak.[i] Household level weights were then assigned to each eligible adult in every recruited household. In the second stage, sample demographics were balanced to match target population parameters for gender, age, education, race and Hispanic ethnicity, division (US Census definitions), housing type, telephone usage, and religion. The parameter for religious affiliation was derived from the 2020 American National Social Network Survey. The telephone usage parameter came from an analysis of the National Health Interview Survey. All other weighting parameters were derived from an analysis of the US Census Bureau’s Current Population Survey. The sample weighting was accomplished using an iterative proportional fitting (IFP) process that simultaneously balances the distributions of all variables. Weights were trimmed to prevent individual interviews from having too much influence on the results.
The use of survey weights in statistical analyses ensures that the demographic characteristics of the sample closely approximate the demographic characteristics of the target population. The margin of error for the survey is +/– 1.87 percentage points at the 95 percent level of confidence. The design effect for the survey is 1.83.
Notes
[1] US Census Bureau, “Historical Marital Status Tables,” November 2021, https://www.census.gov/data/tables/time-series/demo/families/marital.html; and Bryan Walsh, “The Great Population Growth Slowdown,” Vox, January 5, 2022, https://www.vox.com/future-perfect/2022/1/5/22867184/us-census-population-growth-slowdown-migration-birth-death.
[2] Paul Hemez and Chanell Washington, “Percentage and Number of Children Living with Two Parents Has Dropped Since 1968,” US Census Bureau, April 12, 2021, https://www.census.gov/library/stories/2021/04/number-of-children-living-only-with-their-mothers-has-doubled-in-past-50-years.html.
[3] Hemez and Washington, “Percentage and Number of Children Living with Two Parents Has Dropped Since 1968.”
[4] Gretchen Livingston, Kim Parker, and Molly Rohal, “Four-in-Ten Couples Are Saying ‘I Do,’ Again: Growing Number of Adults Have Remarried,” Pew Research Center, November 14, 2014, 8–9, https://www.pewresearch.org/social-trends/2014/11/14/chapter-1-trends-in-remarriage-in-the-u-s/.
[5] Daniel Cox, “Emerging Trends and Enduring Patterns in American Family Life,” AEI Survey Center on American Life, February 9, 2022, https://www.americansurveycenter.org/research/emerging-trends-and-enduring-patterns-in-american-family-life/.
The American Community Survey calculates a similar divorce rate, though it uses a slightly different method. According to a recent release, “Among ever-married adults 20 years and over, 34% of women and 33% of men had ever been divorced.” See US Census Bureau, “Number, Timing and Duration of Marriages and Divorces,” press release, April 22, 2021, https://www.census.gov/newsroom/press-releases/2021/marriages-and-divorces.html.
[6] Pew Research Center, “Parenting in America,” December 17, 2015, https://www.pewresearch.org/social-trends/2015/12/17/1-the-american-family-today/.
[7] Richard Fry and Kim Parker, “Rising Share of U.S. Adults Are Living Without a Spouse or Partner,” Pew Research Center, October 5, 2021, https://www.pewresearch.org/social-trends/2021/10/05/rising-share-of-u-s-adults-are-living-without-a-spouse-or-partner/.
[8] US Census Bureau, “Number, Timing and Duration of Marriages and Divorces.”
[9] See the General Social Survey 1972–2021 data at GSS Data Explorer, website, gssdataexplorer.norc.org.
[10] Americans were categorized as having a spouse of the same religion if they identified their spouse as having the same religious tradition as themselves (e.g., respondent is Catholic and their spouse is Catholic). In this analysis, evangelical Protestantism and mainline Protestantism are considered distinct religious affiliations. Americans who are married to someone of a different denomination (e.g., Baptist and Methodist) are not defined as being in an interfaith marriage.
[11] This analysis identifies politically congruent relationships as those between Democrats and Democratic-leaning independents with spouses who are Democrats or lean Democrat. Republicans’ relationships are similarly defined.
[12] US Bureau of Labor Statistics, “Marriage and Divorce: Patterns by Gender, Race, and Educational Attainment,” October 2013, https://www.bls.gov/opub/mlr/2013/article/pdf/marriage-and-divorce-patterns-by-gender-race-and-educational-attainment.pdf; and Eli J. Finkel, “Educated Americans Paved the Way for Divorce—Then Embraced Marriage,” Atlantic, January 8, 2019, https://www.theatlantic.com/family/archive/2019/01/education-divide-marriage/579688/.
[13] “Single” is defined in this report as being unmarried, not having a cohabitating partner, and not being in a committed romantic relationship.
[14] Brady E. Hamilton, Joyce A. Martin, and Michelle J. K. Osterman, “Births: Provisional Data for 2020,” Centers for Disease Control and Prevention, National Center for Health Statistics, May 2021, https://www.cdc.gov/nchs/data/vsrr/vsrr012-508.pdf.
[15] Melissa S. Kearney and Phillip Levine, “Will Births in the US Rebound? Probably Not.,” Brookings Institution, May 24, 2021, https://www.brookings.edu/blog/up-front/2021/05/24/will-births-in-the-us-rebound-probably-not/.
[16] US Census Bureau, “Historical Marital Status Tables,” November 2021, https://www.census.gov/data/tables/time-series/demo/families/marital.html.
[17] Quoctrung Bui and Claire Cain Miller, “The Age That Women Have Babies: How a Gap Divides America,” New York Times, August 4, 2018, https://www.nytimes.com/interactive/2018/08/04/upshot/up-birth-age-gap.html.
[18] This analysis includes only those who never got divorced and are currently married to their spouse.
[19] These results were based on a Poisson regression model predicting the number of children that women reported having.
[20] Gallup Organization, “Gallup/CNN/USA Today Poll # 1998-9807019: Parenting/Politics,” Roper Center for Public Opinion Research, 1998, https://ropercenter.cornell.edu/ipoll/study/31088350.
[21] Brian Knop, “One in Six Children Live with a Half Sibling Under 18,” US Census Bureau, January 27, 2020, https://www.census.gov/library/stories/2020/01/more-children-live-with-half-siblings-than-previously-thought.html.
[22] Susan Newman, “Does Your Birth Order Actually Matter?,” Psychology Today, November 17, 2015, https://www.psychologytoday.com/us/blog/singletons/201511/does-your-birth-order-actually-matter.
[23] Leah Campbell, “What Happens to Kids When Parents Play Favorites?,” Healthline,April 12, 2019, https://www.healthline.com/health-news/what-happens-to-kids-when-parents-play-favorites.
[24] The majority of Americans who said they were most likely to turn to a sibling growing up identified this person as a sister.
Survey Reports


In the news
March 21, 2026
Why Some Men Struggle to Keep Up With Friendships
March 20, 2026
What We Lost When We Lost Rom-Coms
March 19, 2026