November 20, 2025
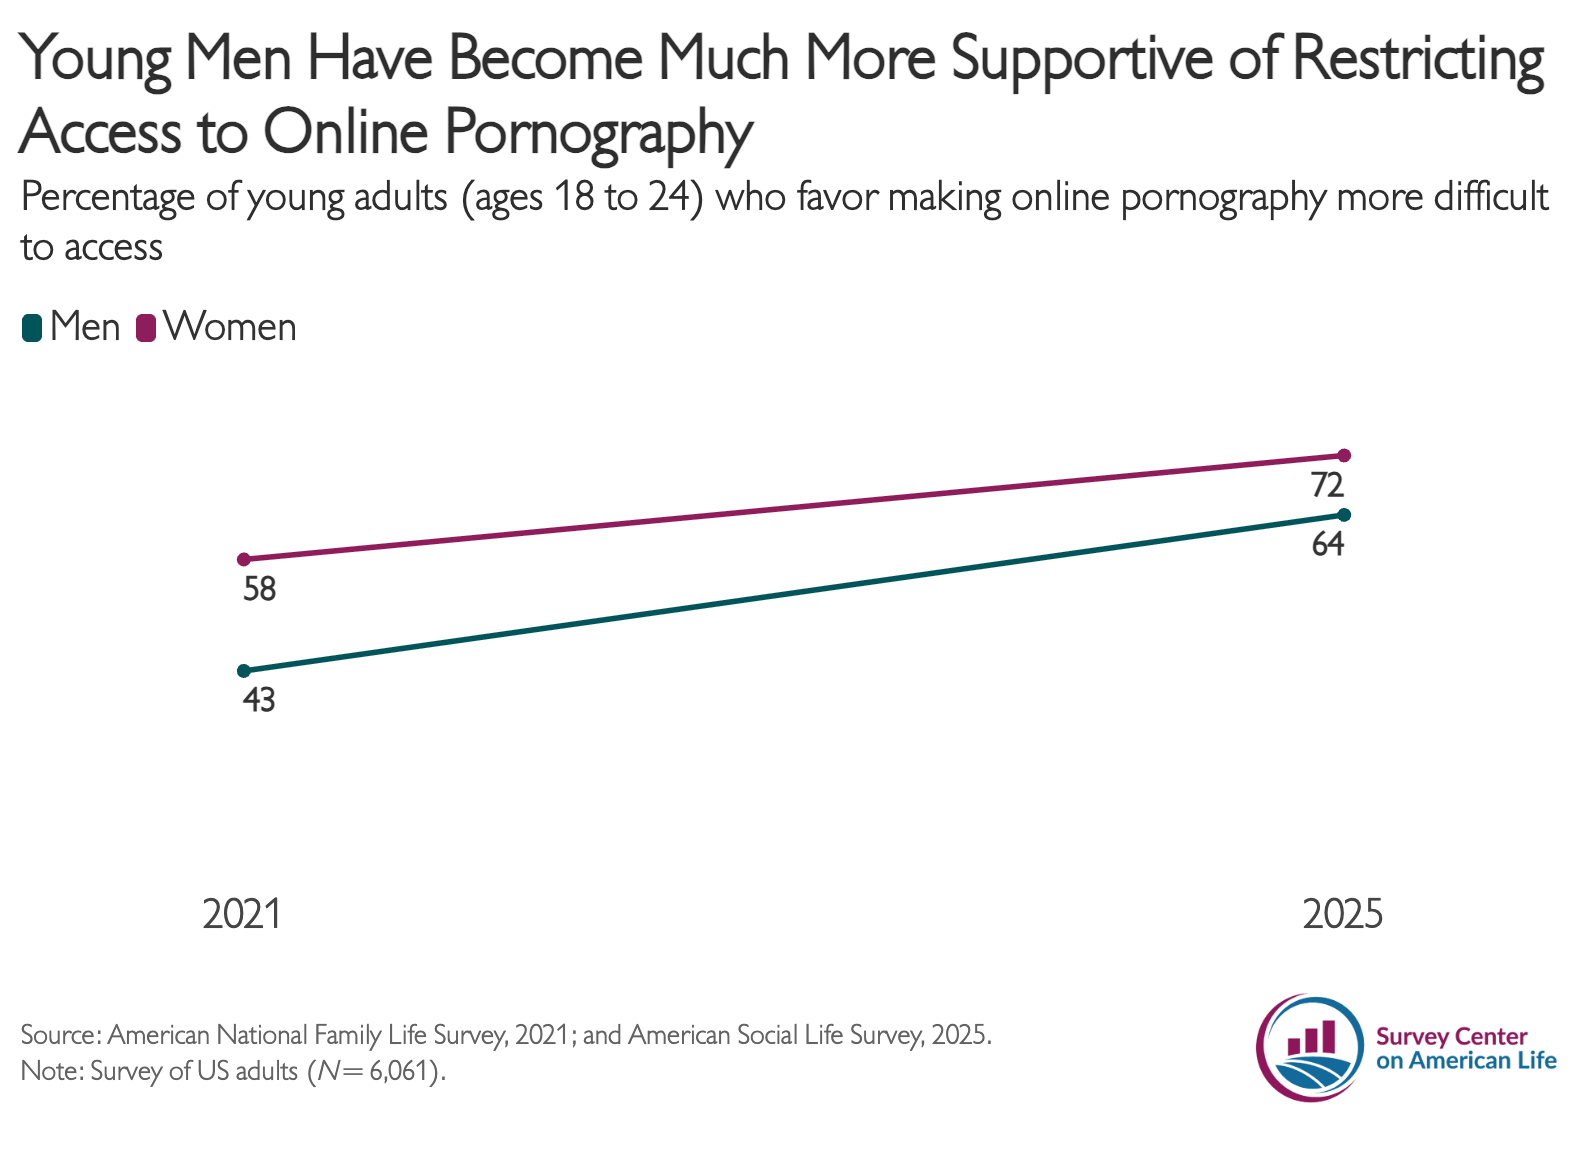
Young Men Increasingly Support Restrictions on Online Pornography
November 3, 2025
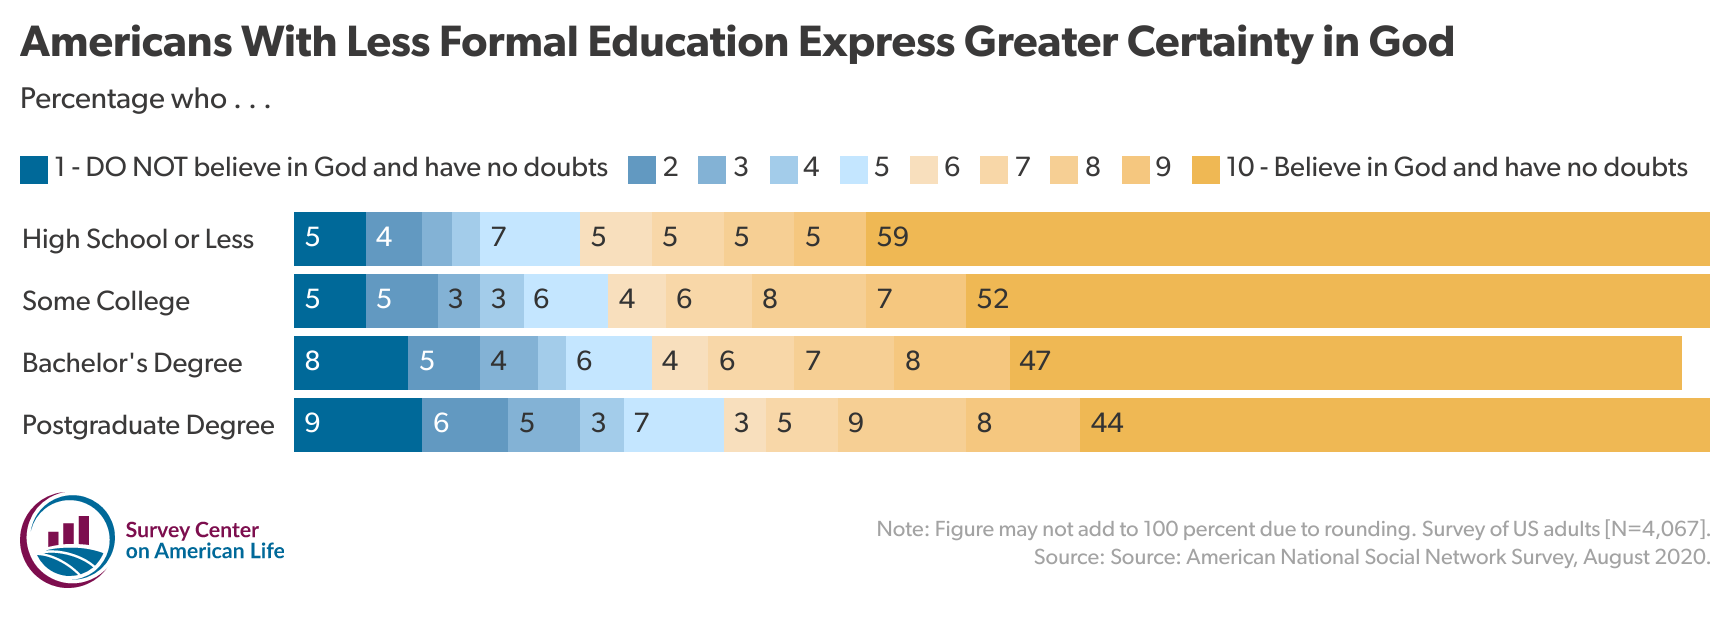
Americans’ Moral Standards Have Become More Definitive

March 25, 2025
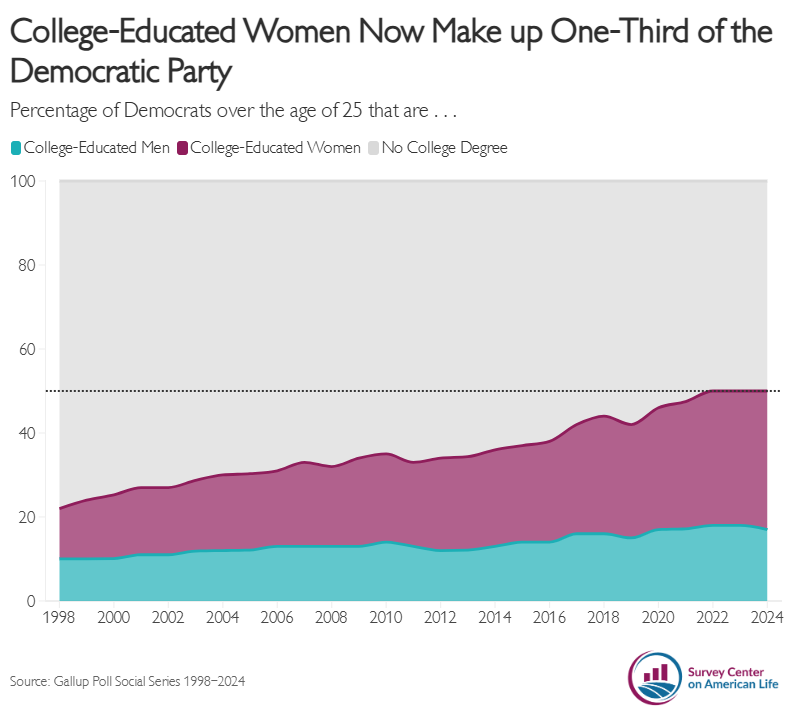
Share of College-Educated Women in the Democratic Party Has Increased
December 10, 2024
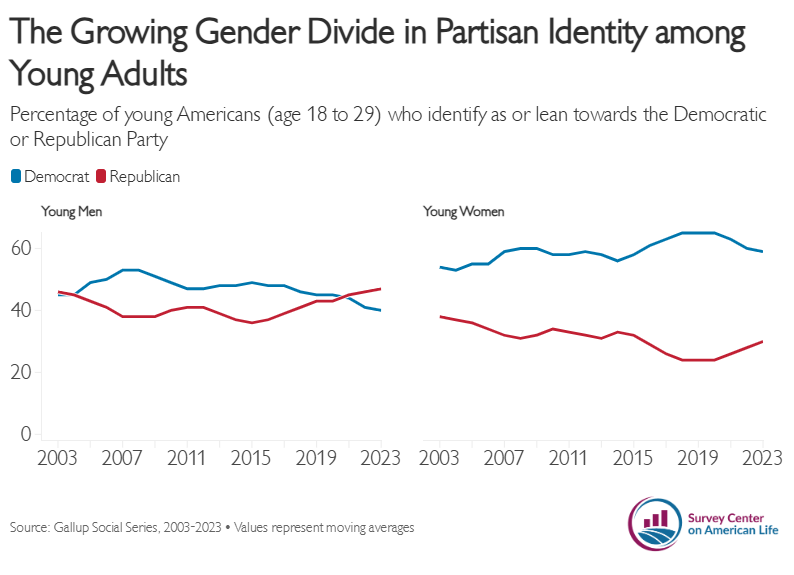
The Gender Divide in Youth Political Affiliation
December 3, 2024
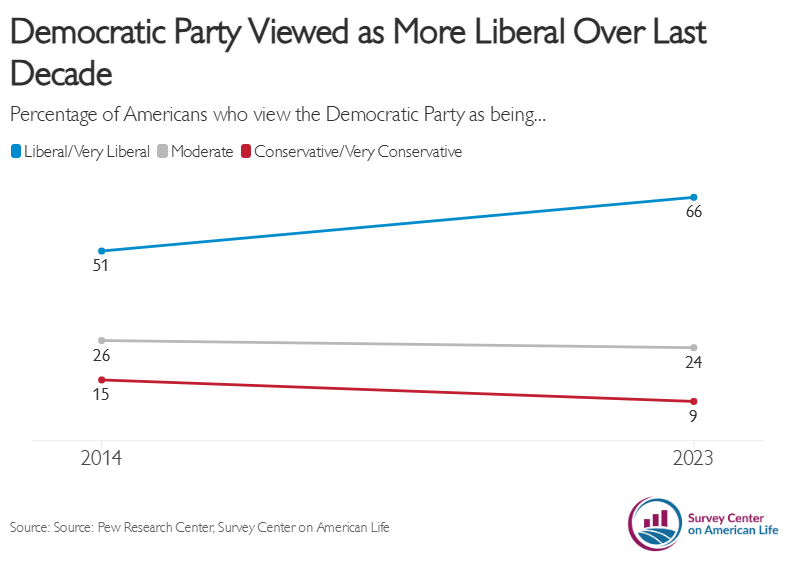
More Americans View the Democratic Party as Liberal
October 31, 2024
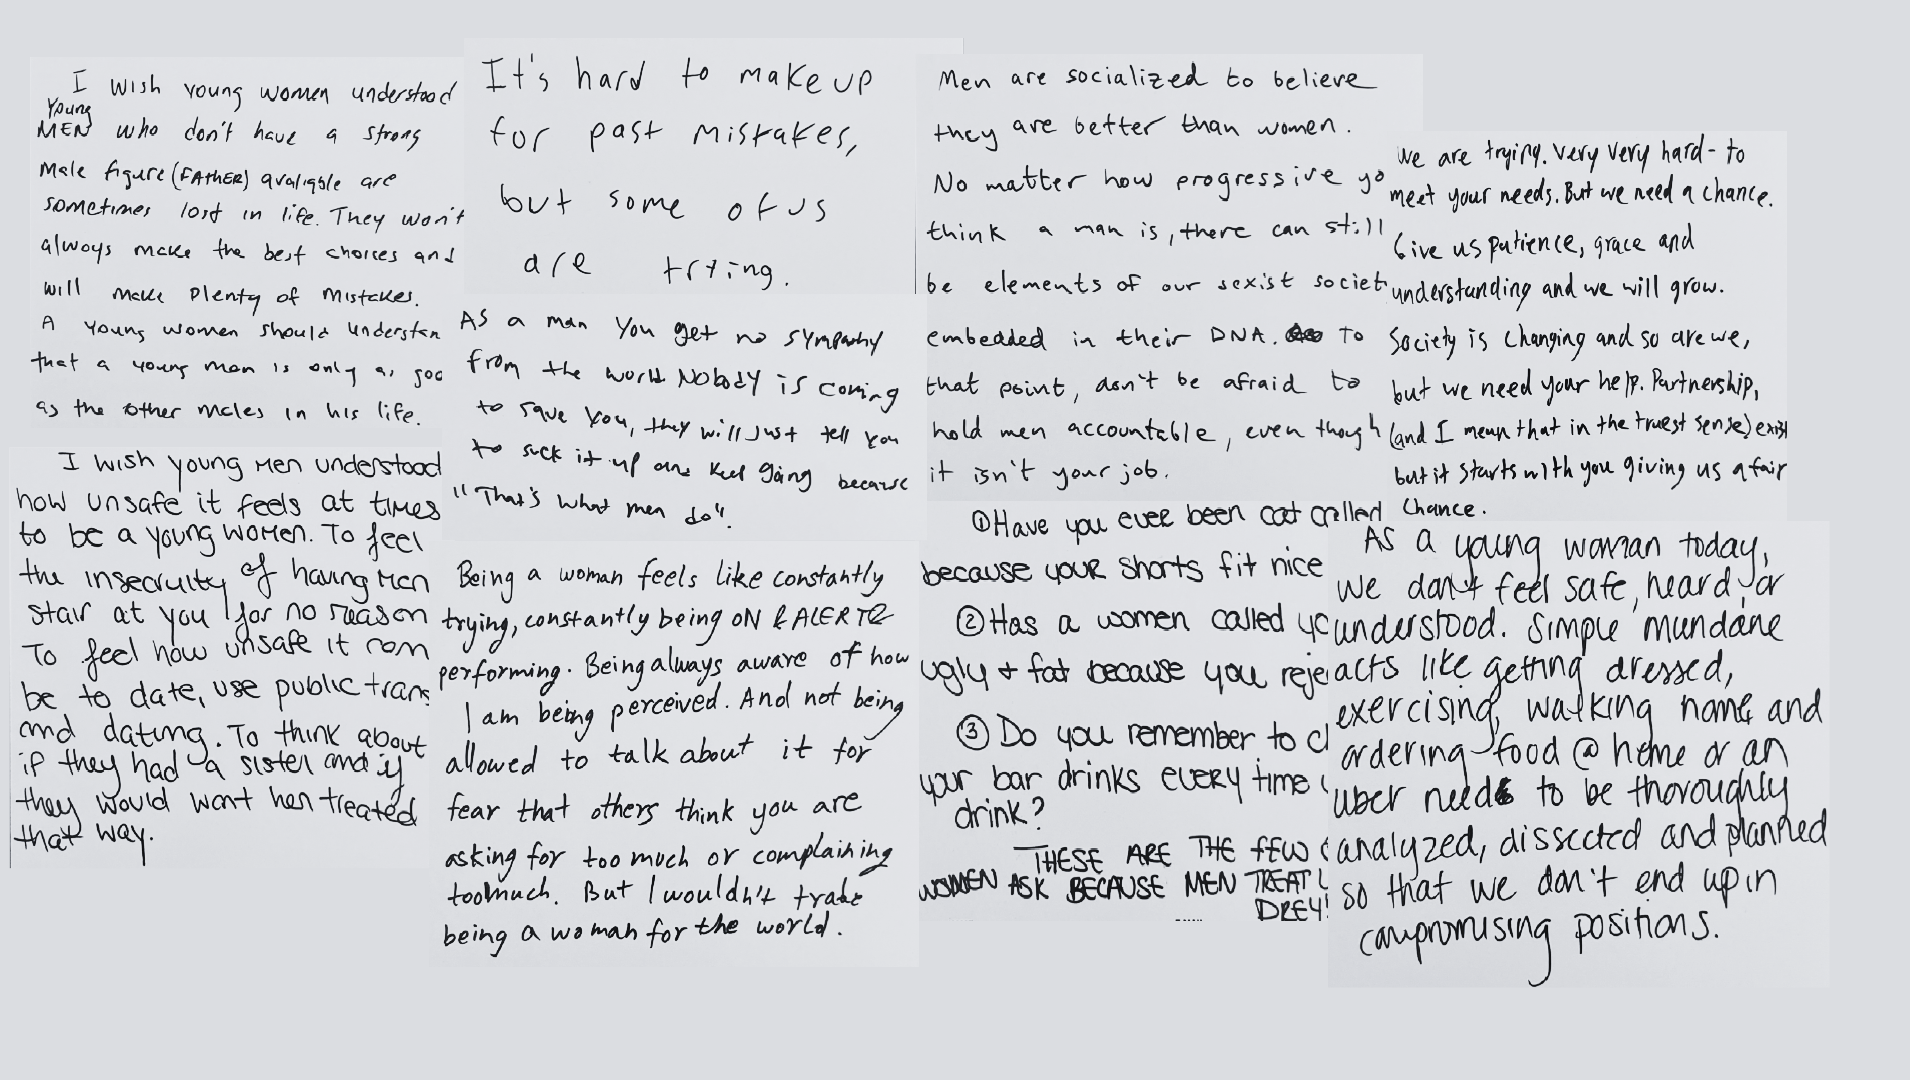
Why Young People Feel Misunderstood By the Opposite Sex
October 25, 2024
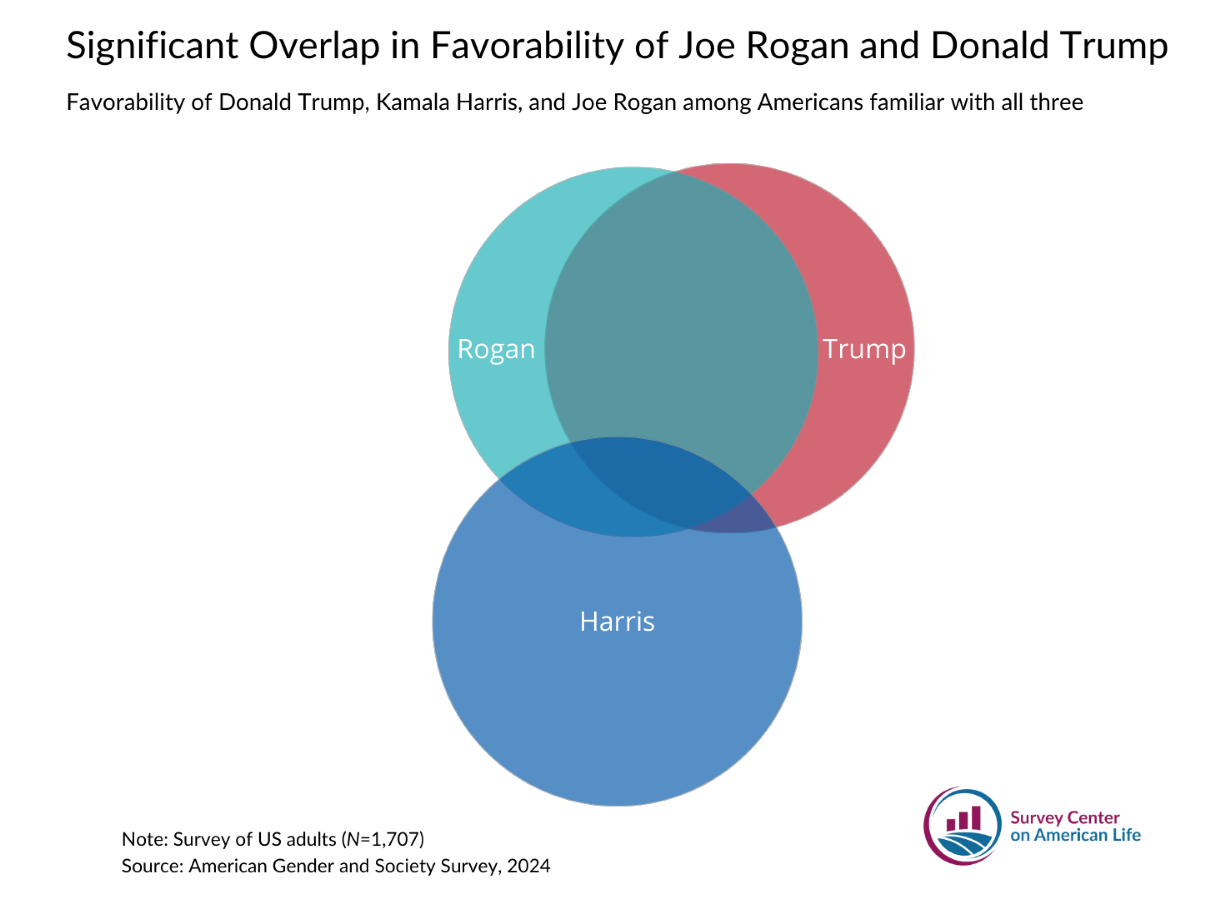
What Trump’s Appearance on Joe Rogan’s Podcast Says About the Gender Divide
June 5, 2024
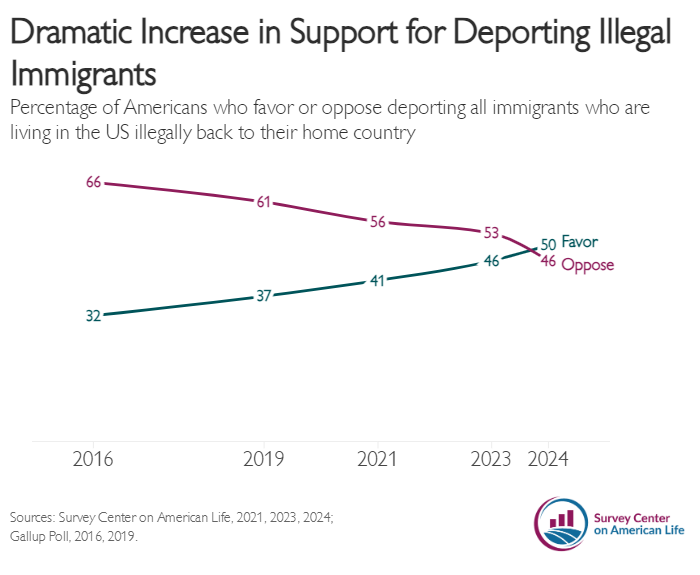
More Americans Favor Deporting Illegal Immigrants
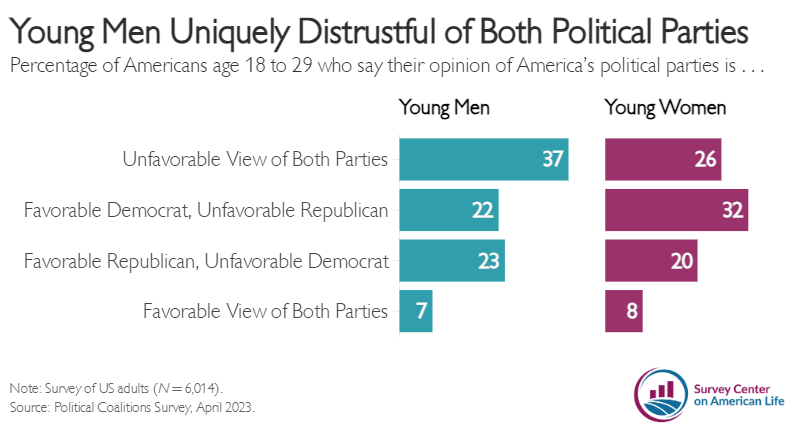
May 1, 2024
Young Men Distrust Both Parties
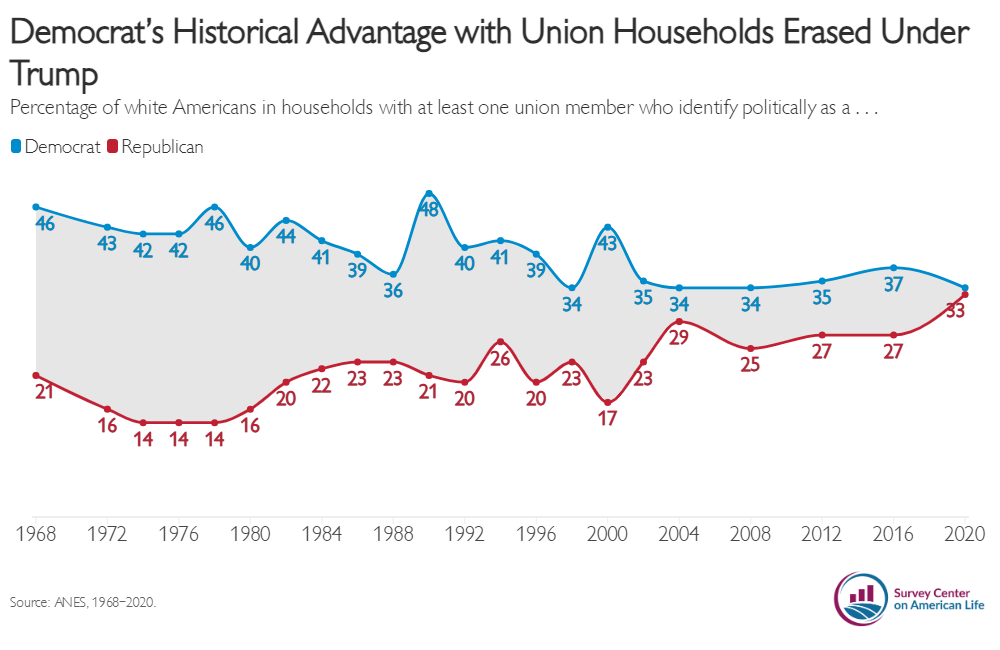
March 25, 2024
White Union Members Grow More Republican
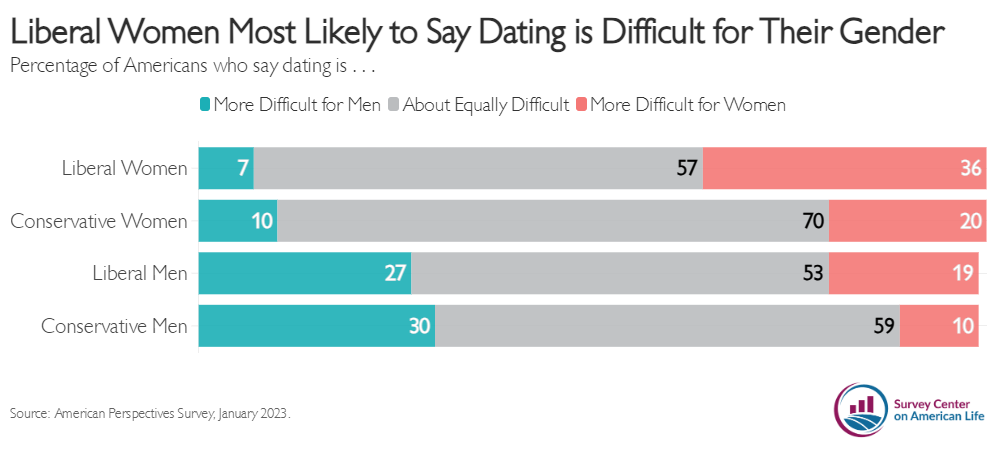
February 15, 2024
Dating Difficulties
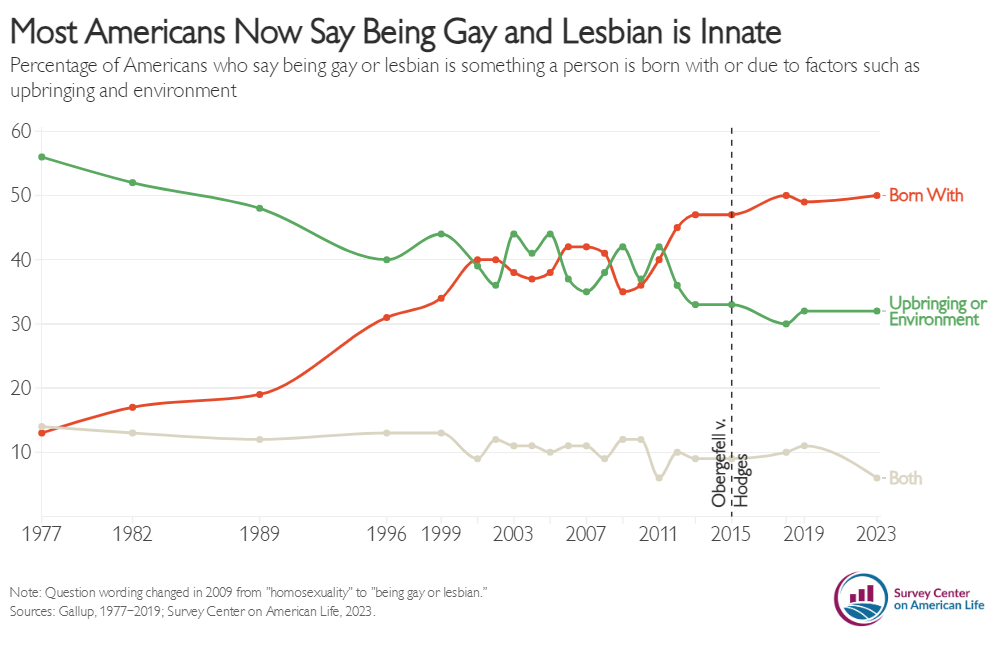
December 8, 2023
Born This Way
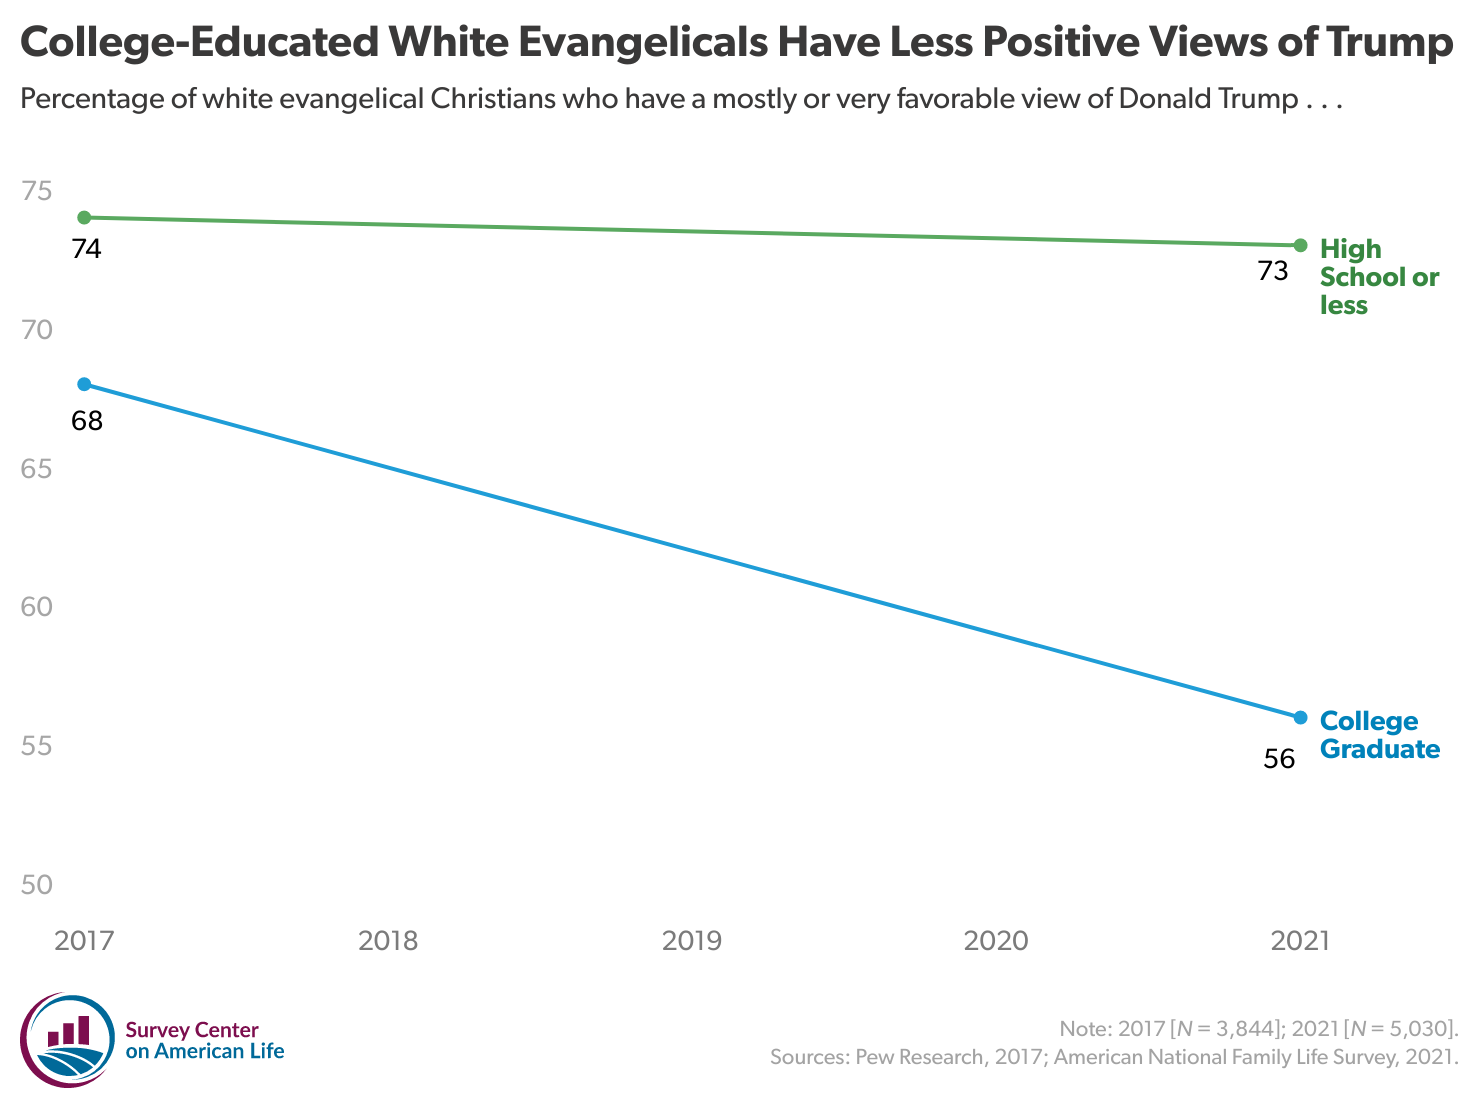
April 7, 2023
White Evangelical Trump Support Fracturing
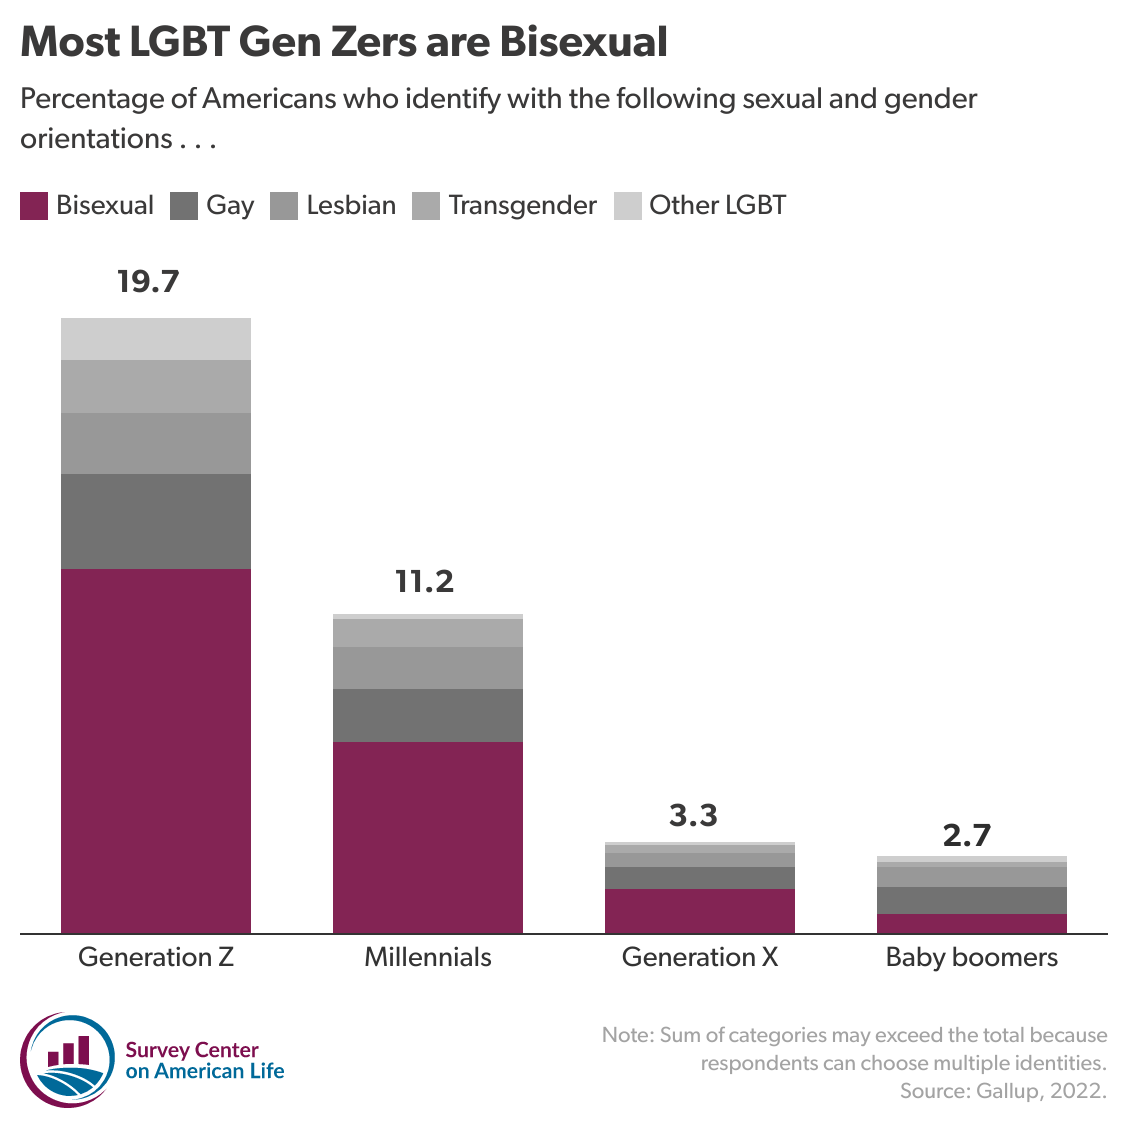
April 4, 2023
A Generational Jump in Bisexuality
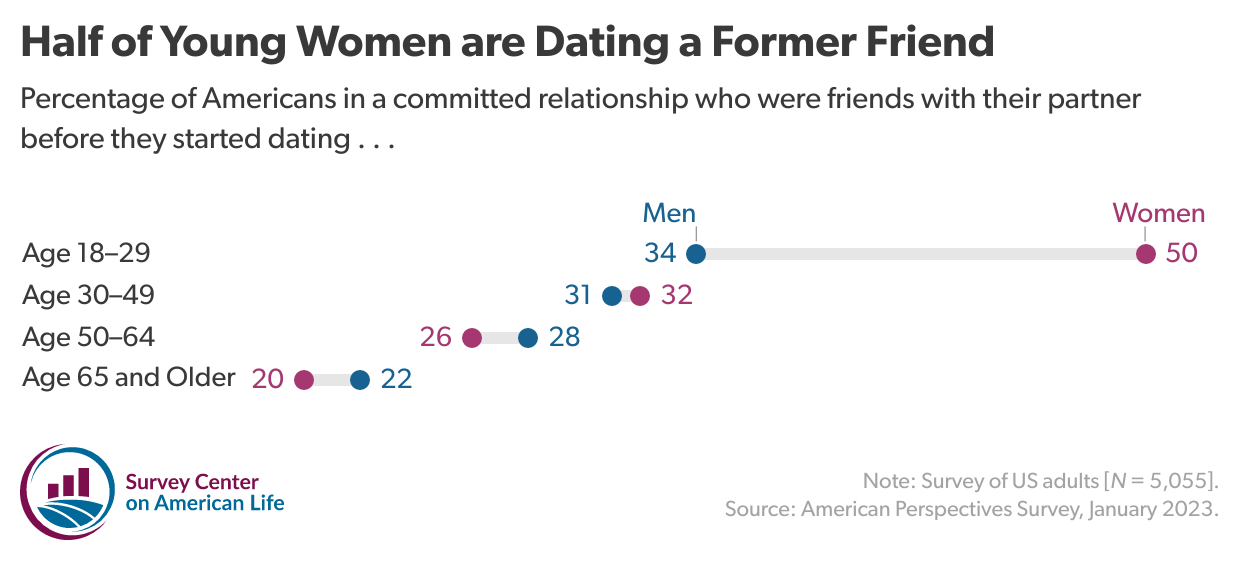
February 22, 2023
Friend Zone
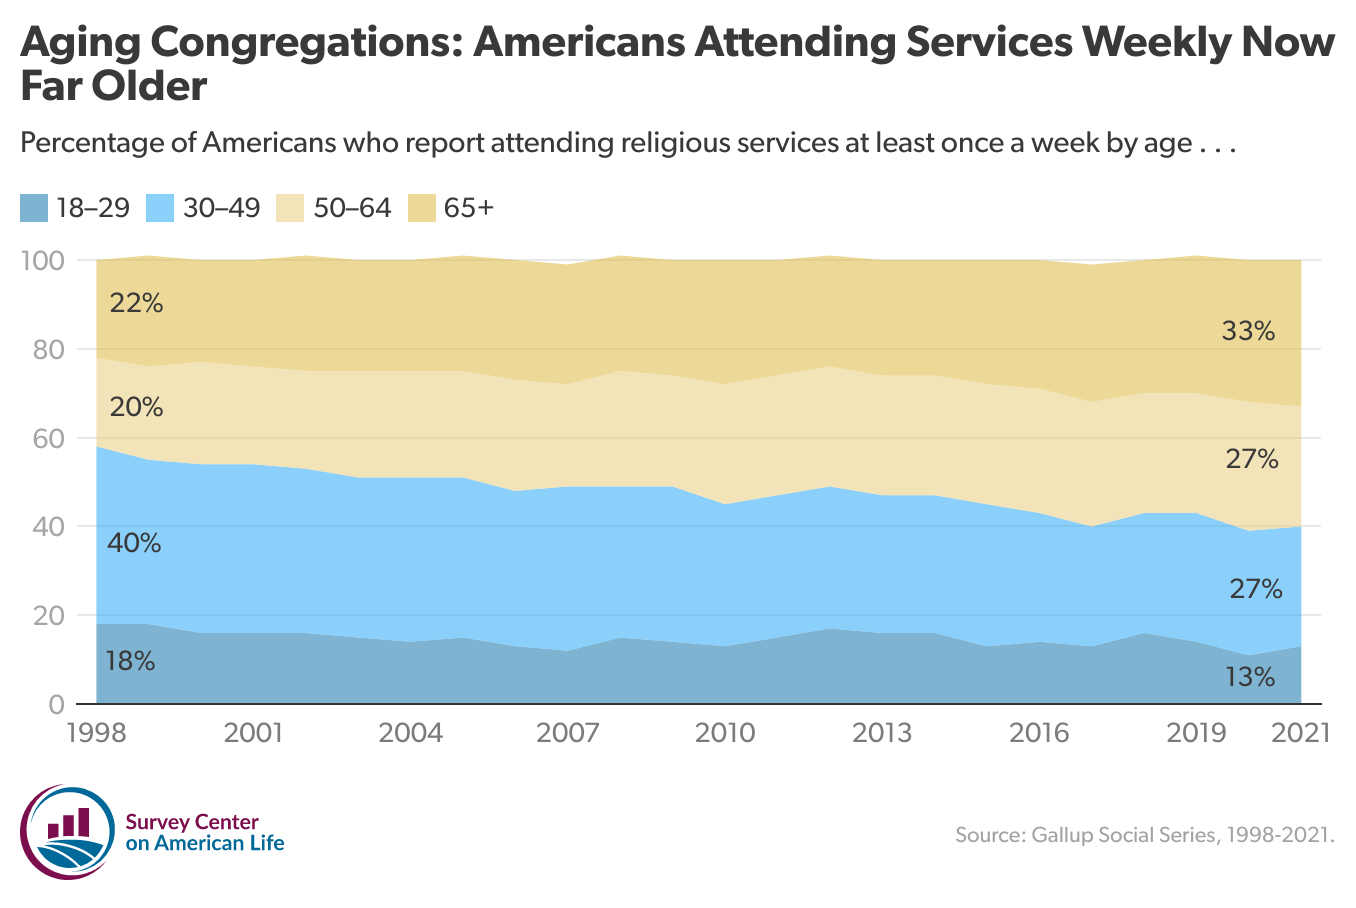
December 22, 2022
Aging in the Pews
November 18, 2022
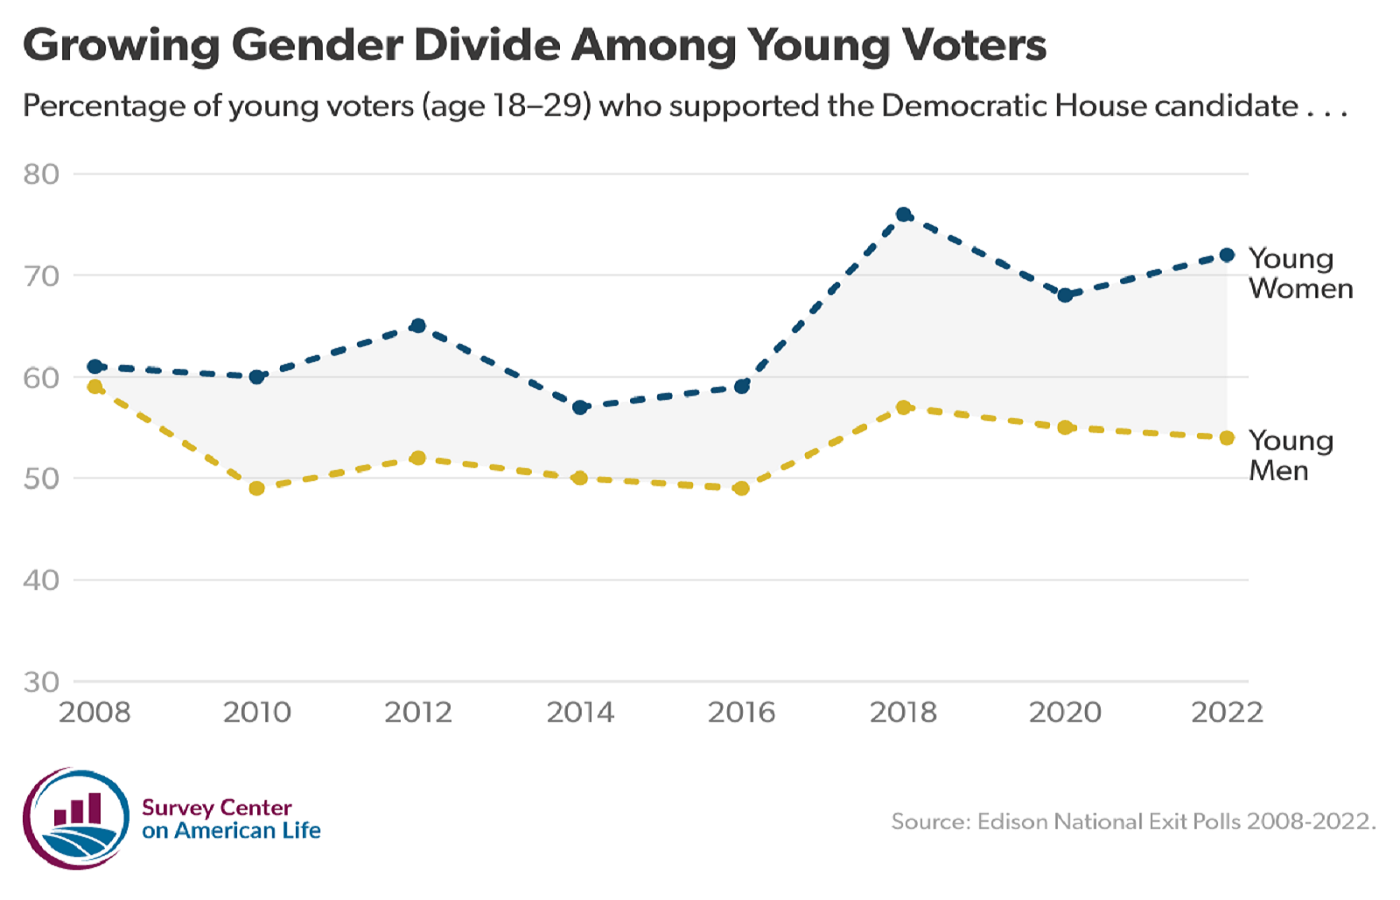
A Growing Gender Divide Among Young Voters
October 26, 2022
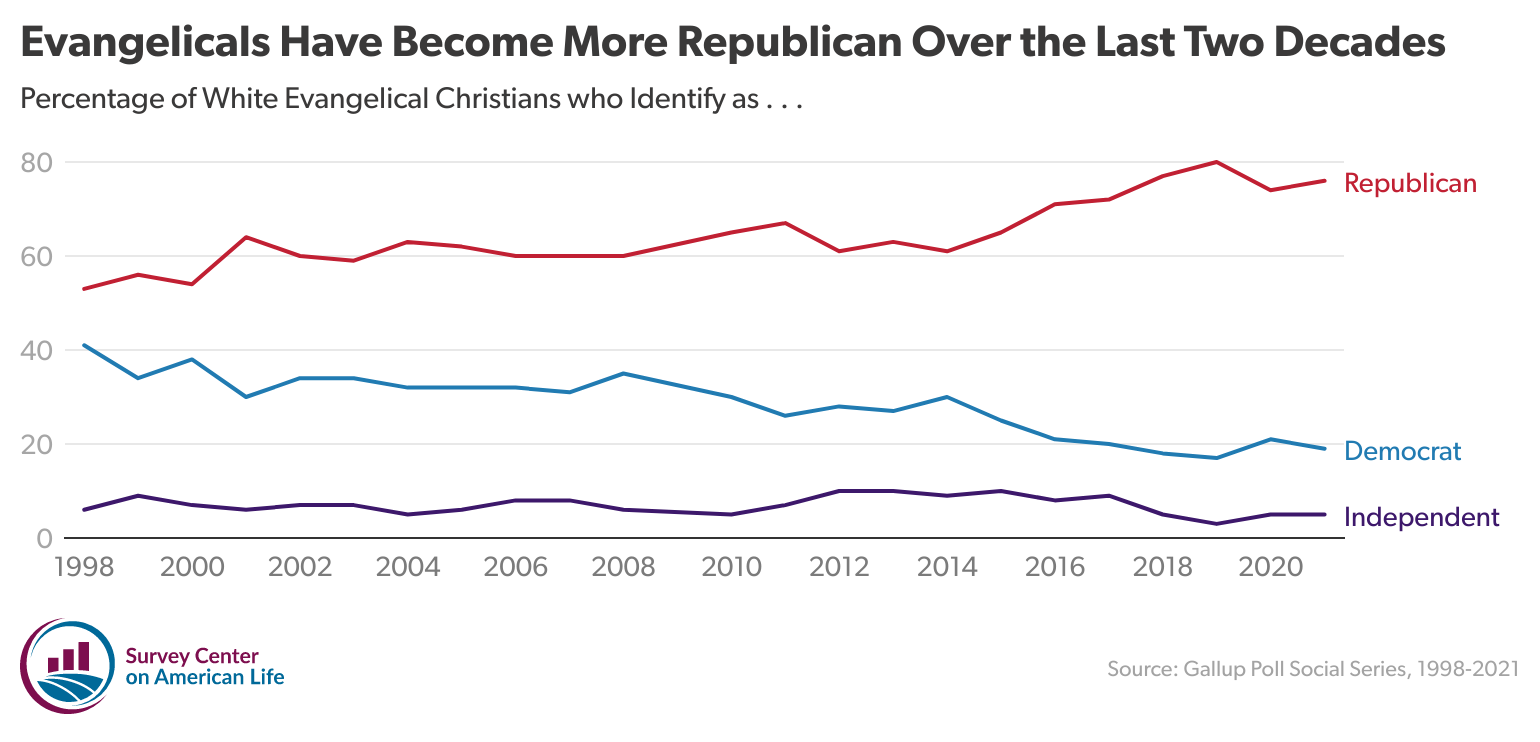
The Political Transformation of White Evangelical Protestants
October 7, 2022
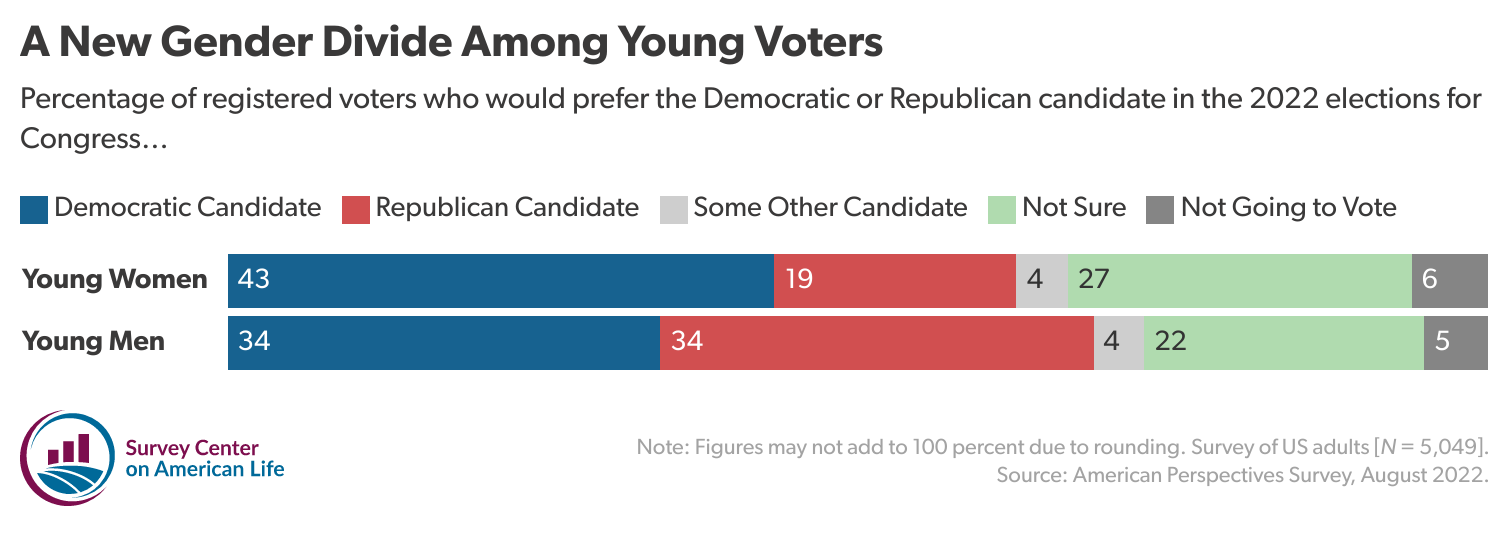
A New Gender Divide Among Young Voters
October 7, 2022
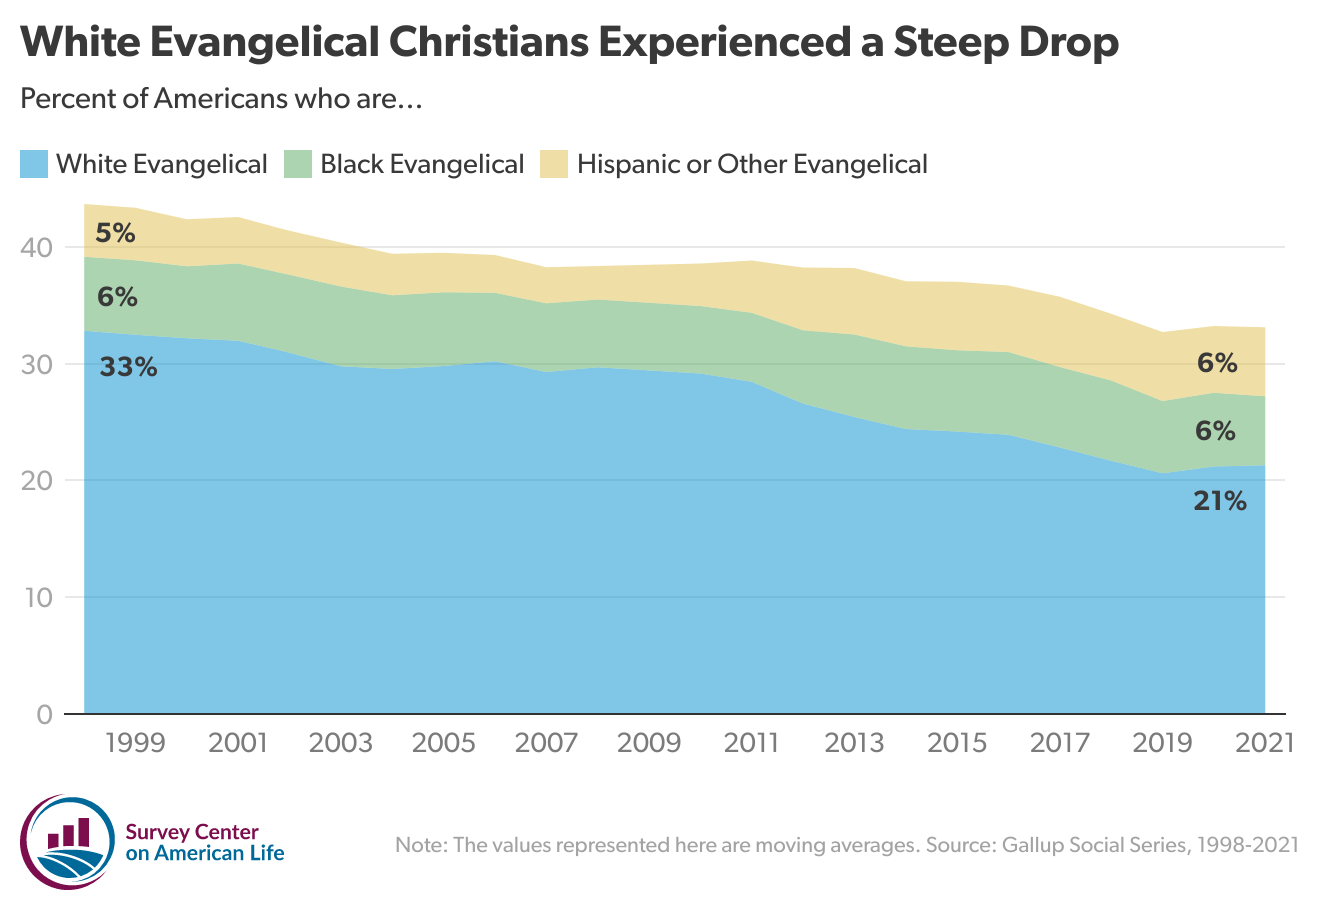
The Decline of White Evangelical Protestants
October 7, 2022
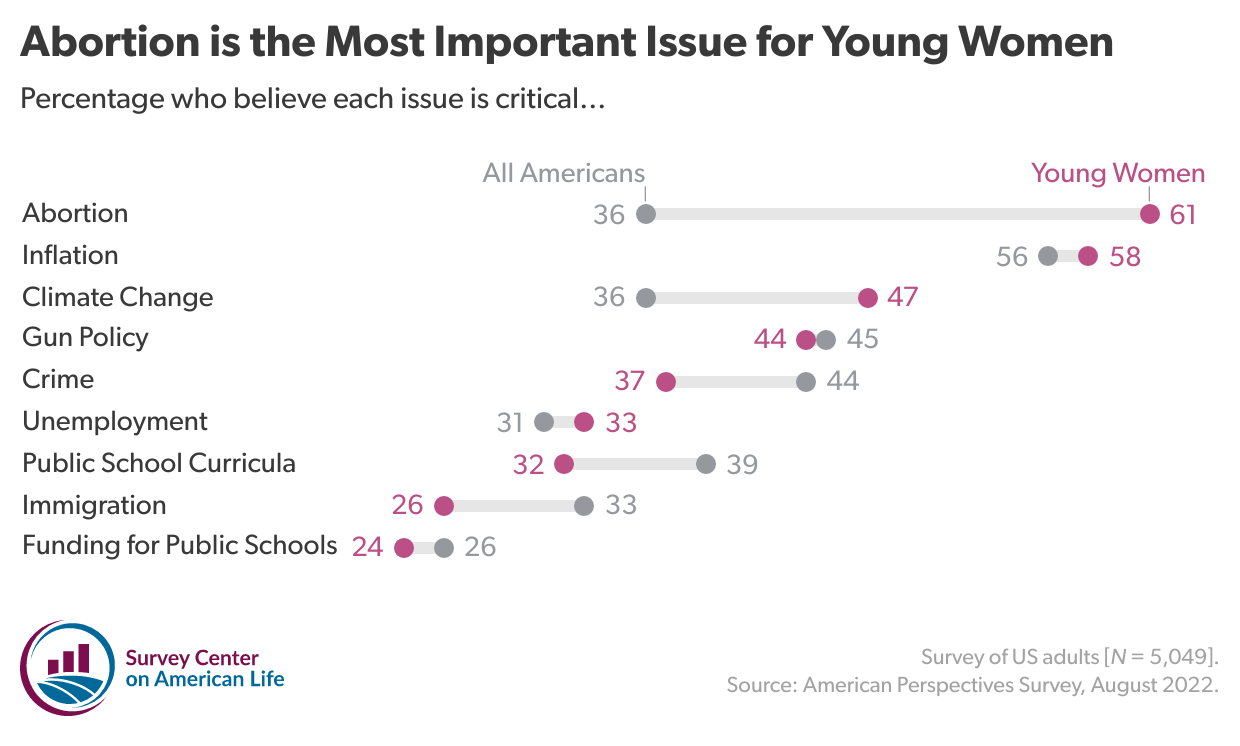
Abortion is a Critical Concern for Young Women
August 31, 2022
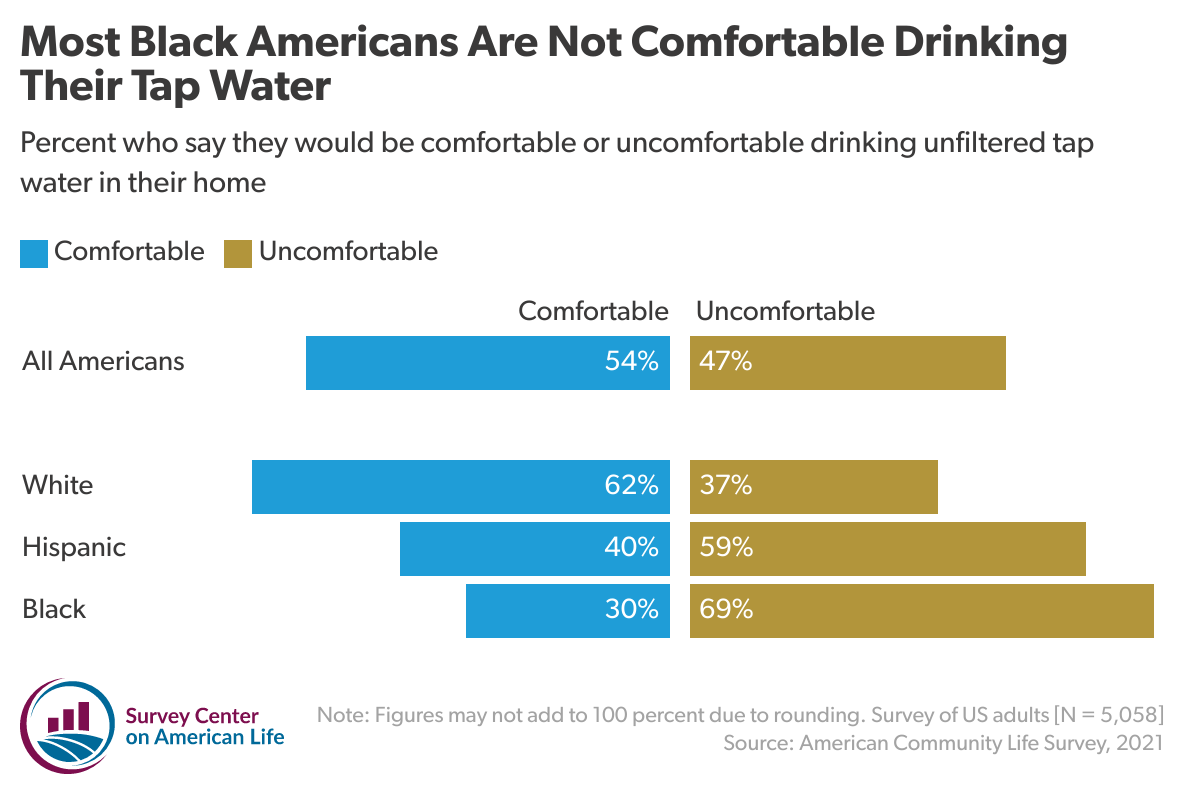
Black Americans Don’t Trust Their Tap Water
July 29, 2022
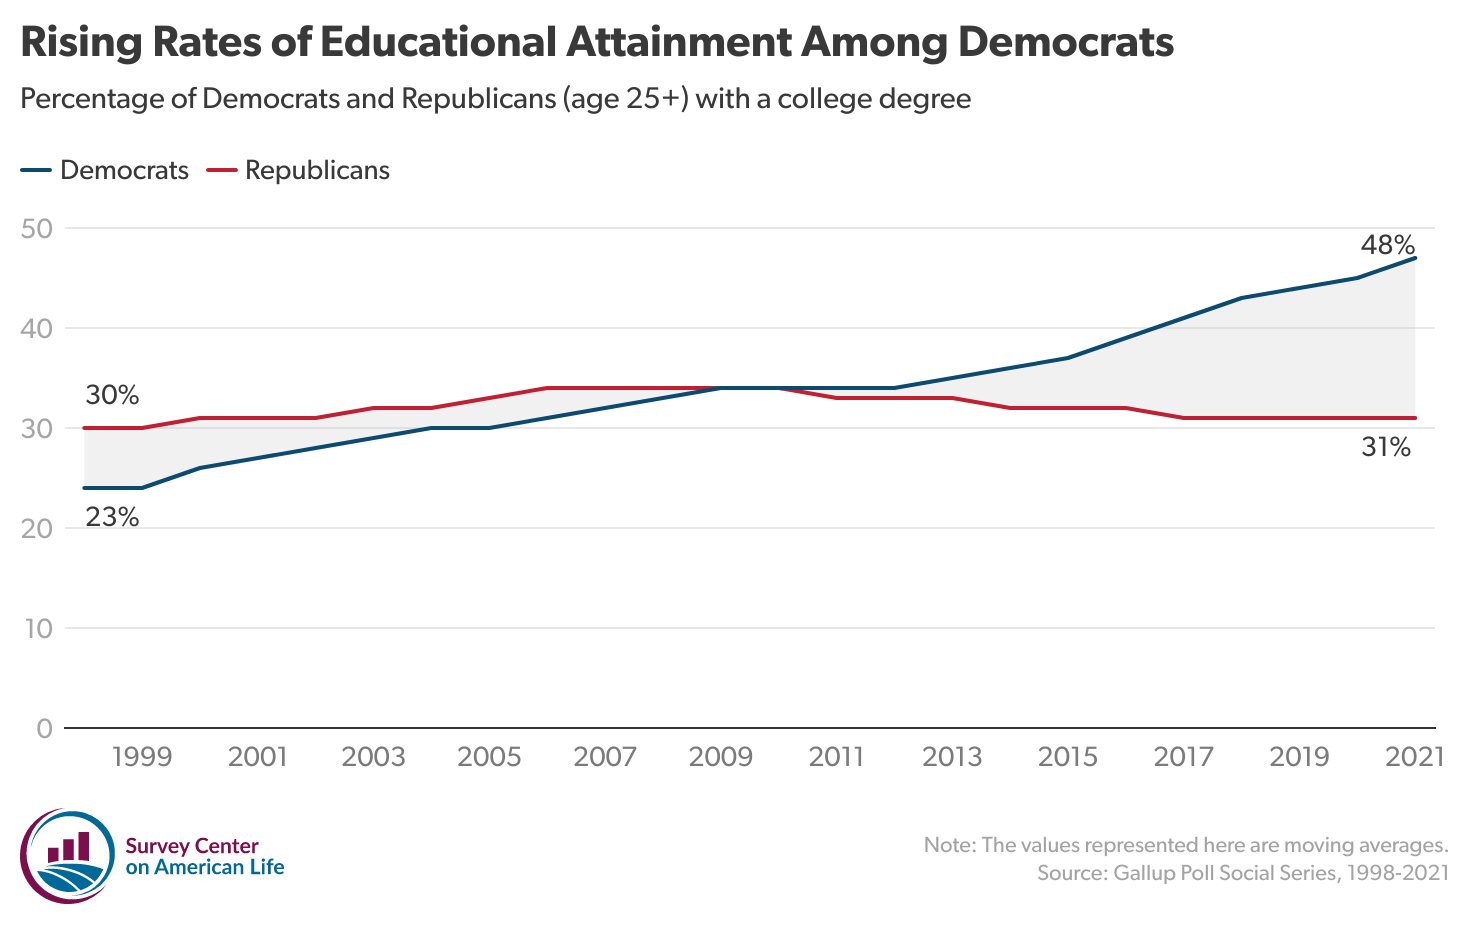
A College-Educated Party?
May 31, 2022
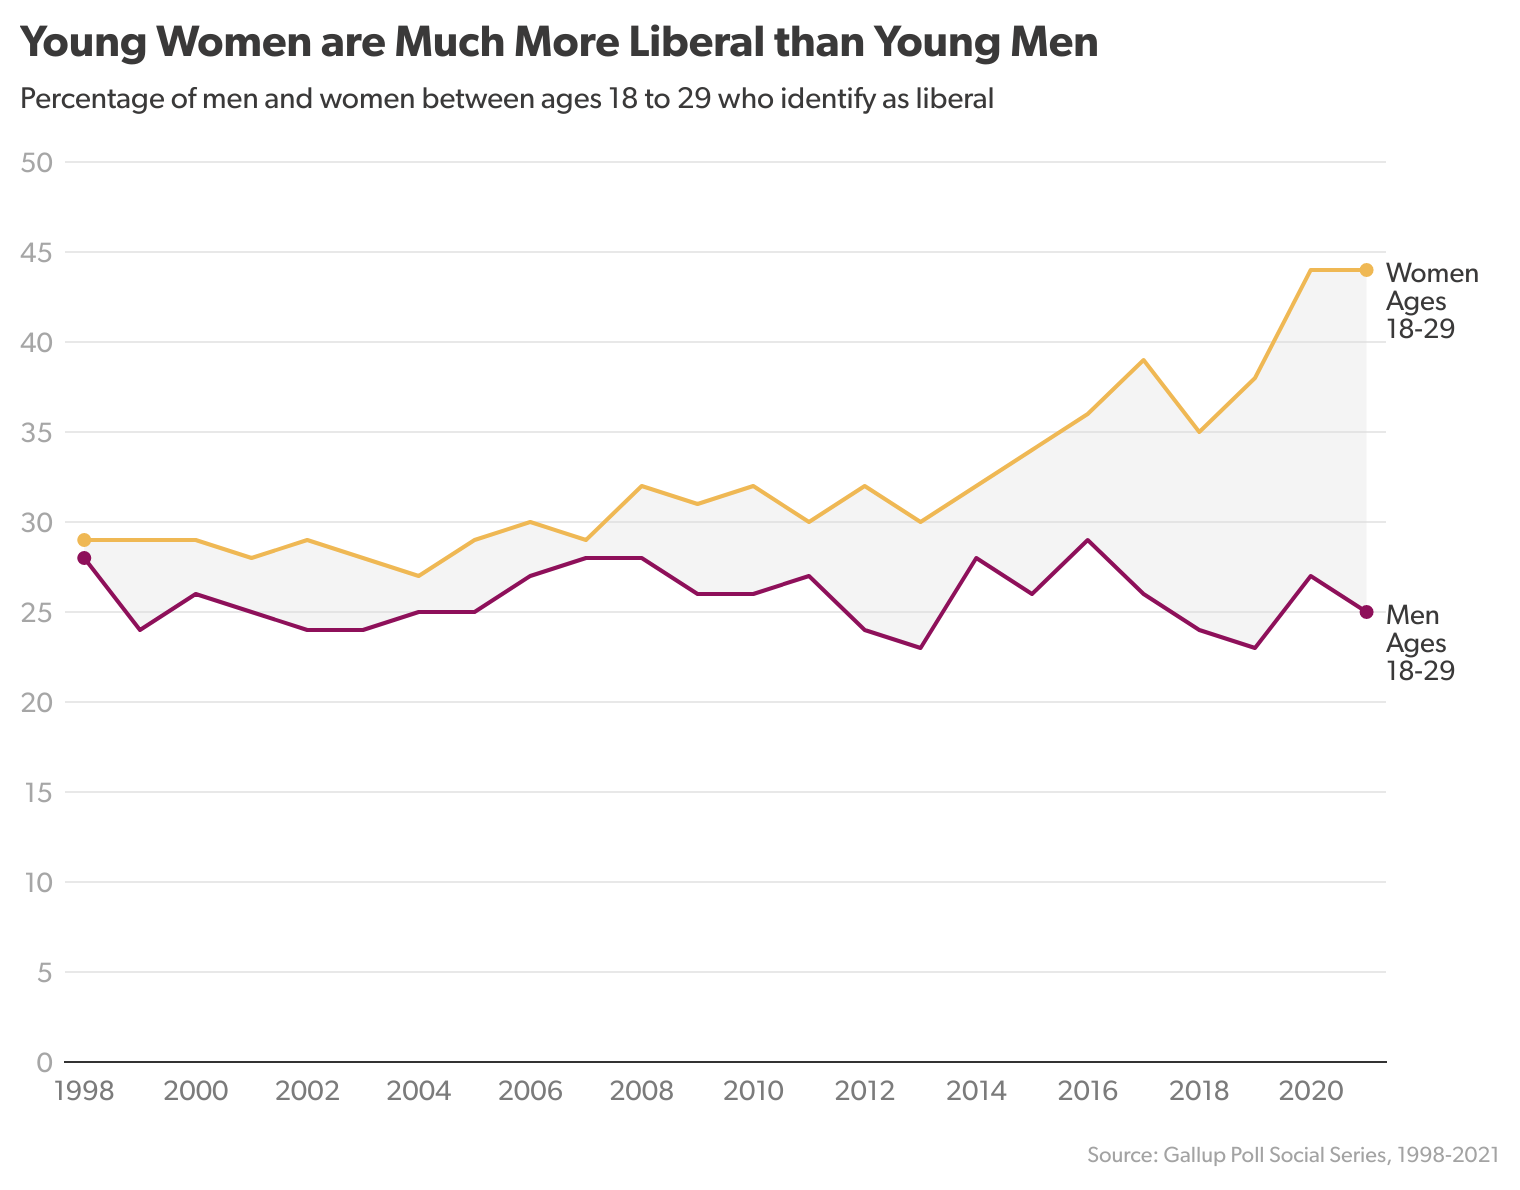
The Growing Political Divide Between Young Men and Women
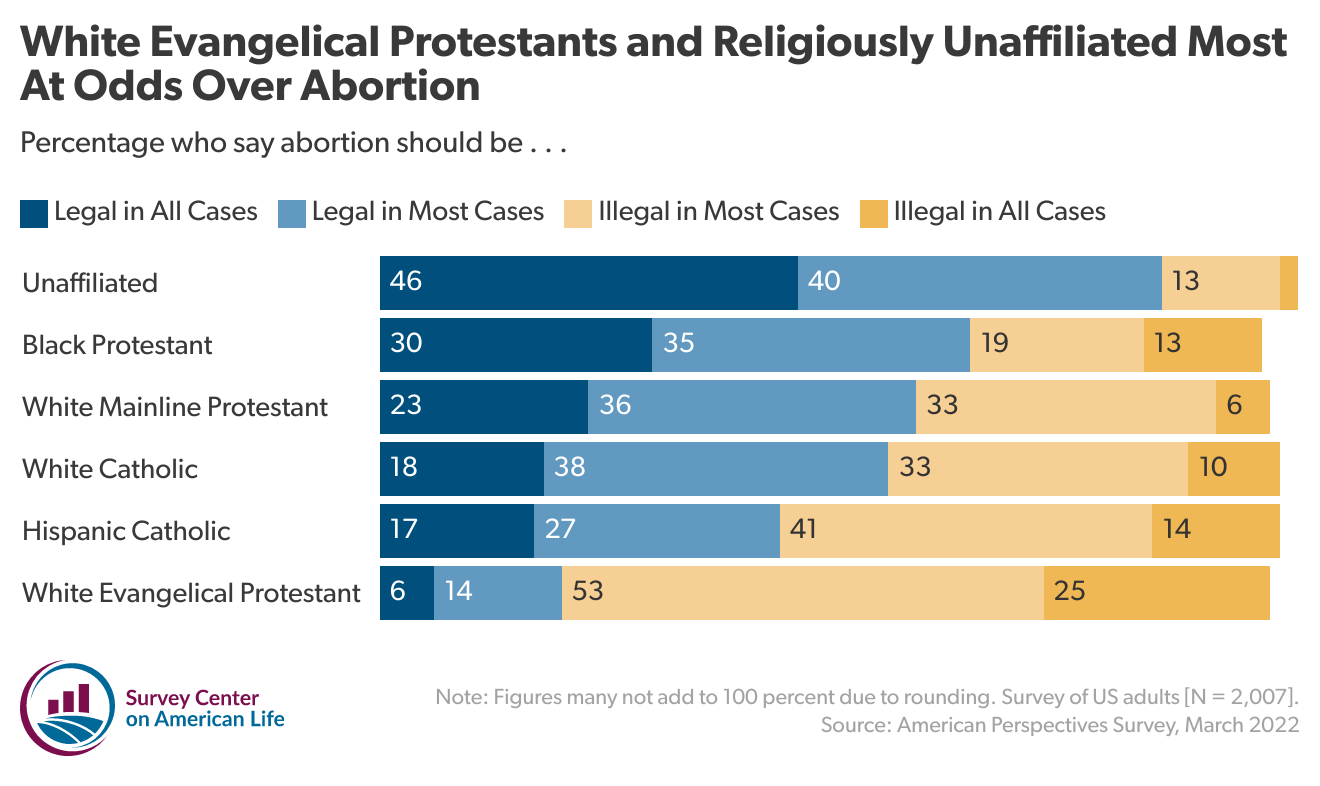
May 3, 2022
Religious Divide Over Abortion
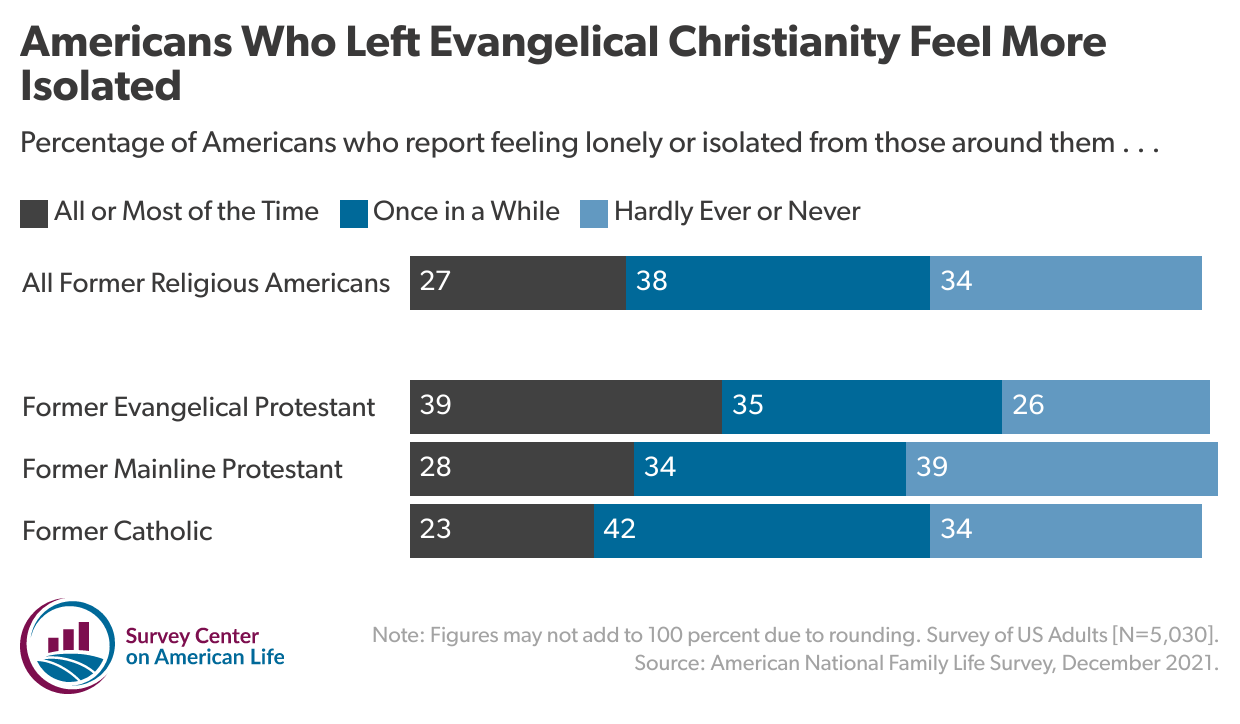
March 29, 2022
Religious Disaffiliation and Loneliness
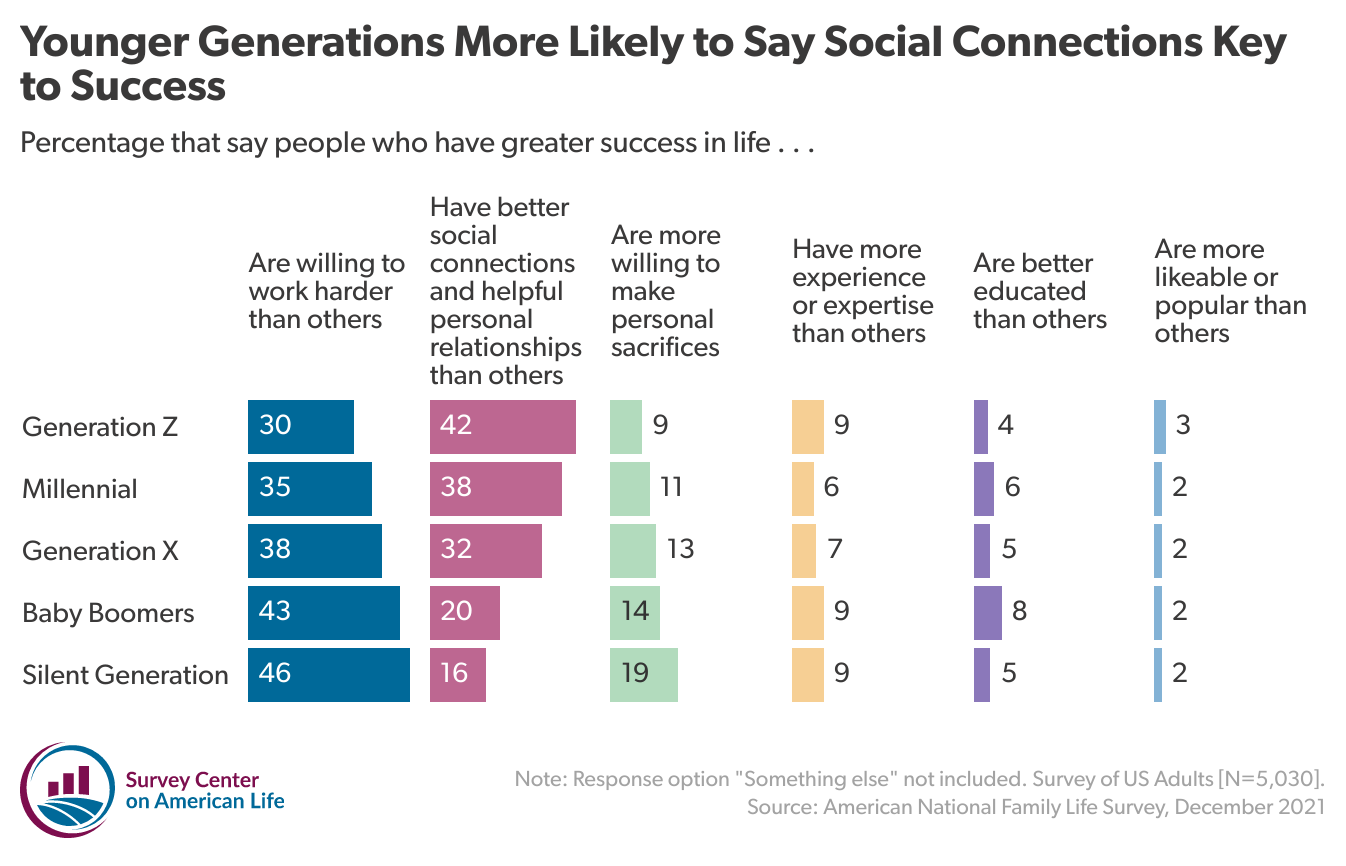
March 7, 2022
Generational Split on Success
February 24, 2022
Race and Sibling Relations
![Chart showing percentage of each group who grew up with siblings who say growing up, they had a [blank] relationship with their siblings](https://www.americansurveycenter.org/wp-content/uploads/2022/02/Bq3hH-majority-of-black-americans-report-very-close-childhood-sibling-relationships-.png)
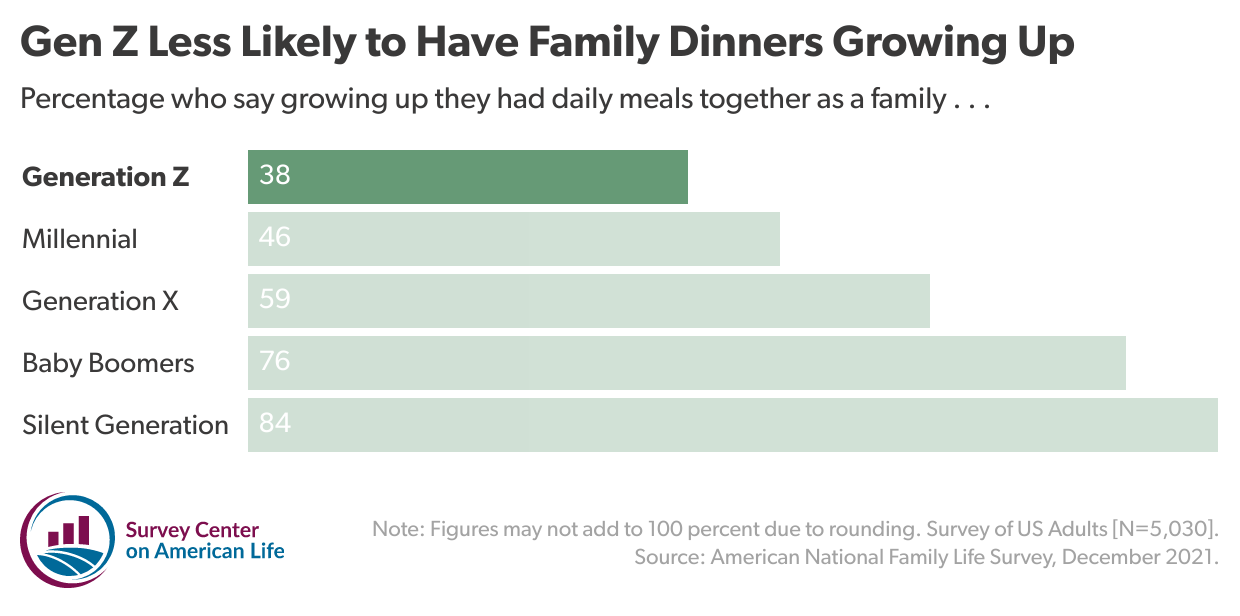
February 9, 2022
Few Gen Zers Grew Up Having Family Dinners
January 21, 2022
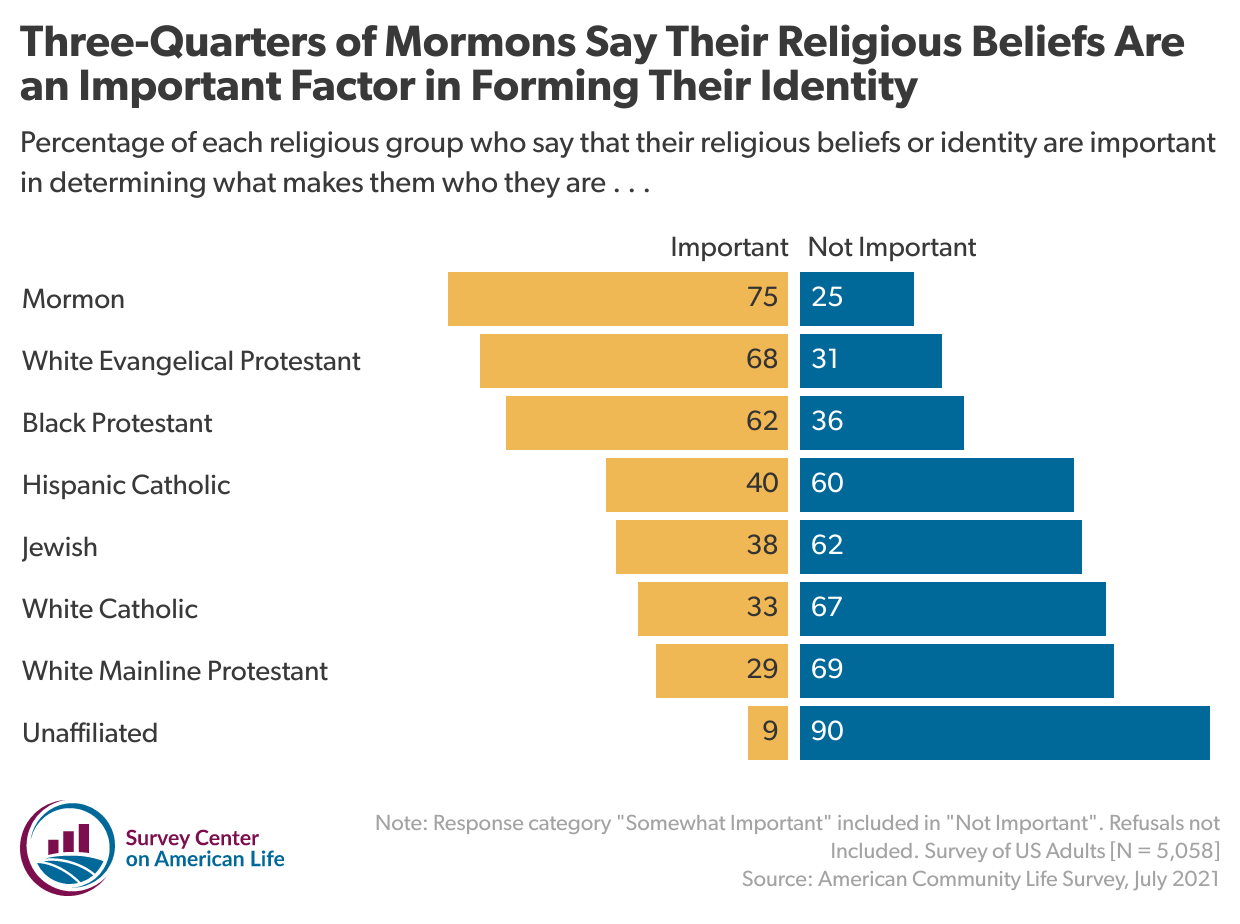
Religion is Not an Important Source of Identity For Many Americans
January 6, 2022
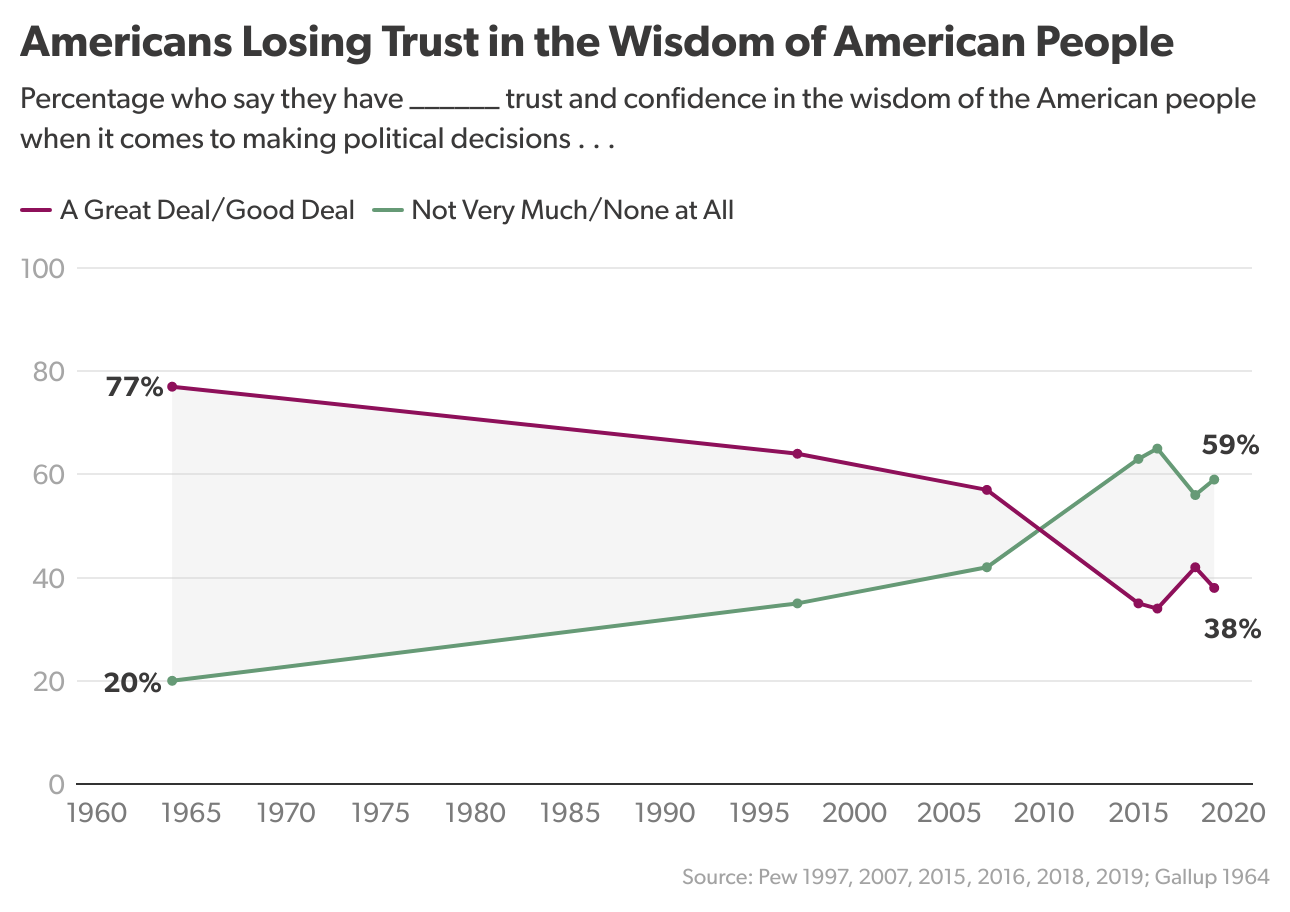
Losing Confidence in Each Other
December 20, 2021
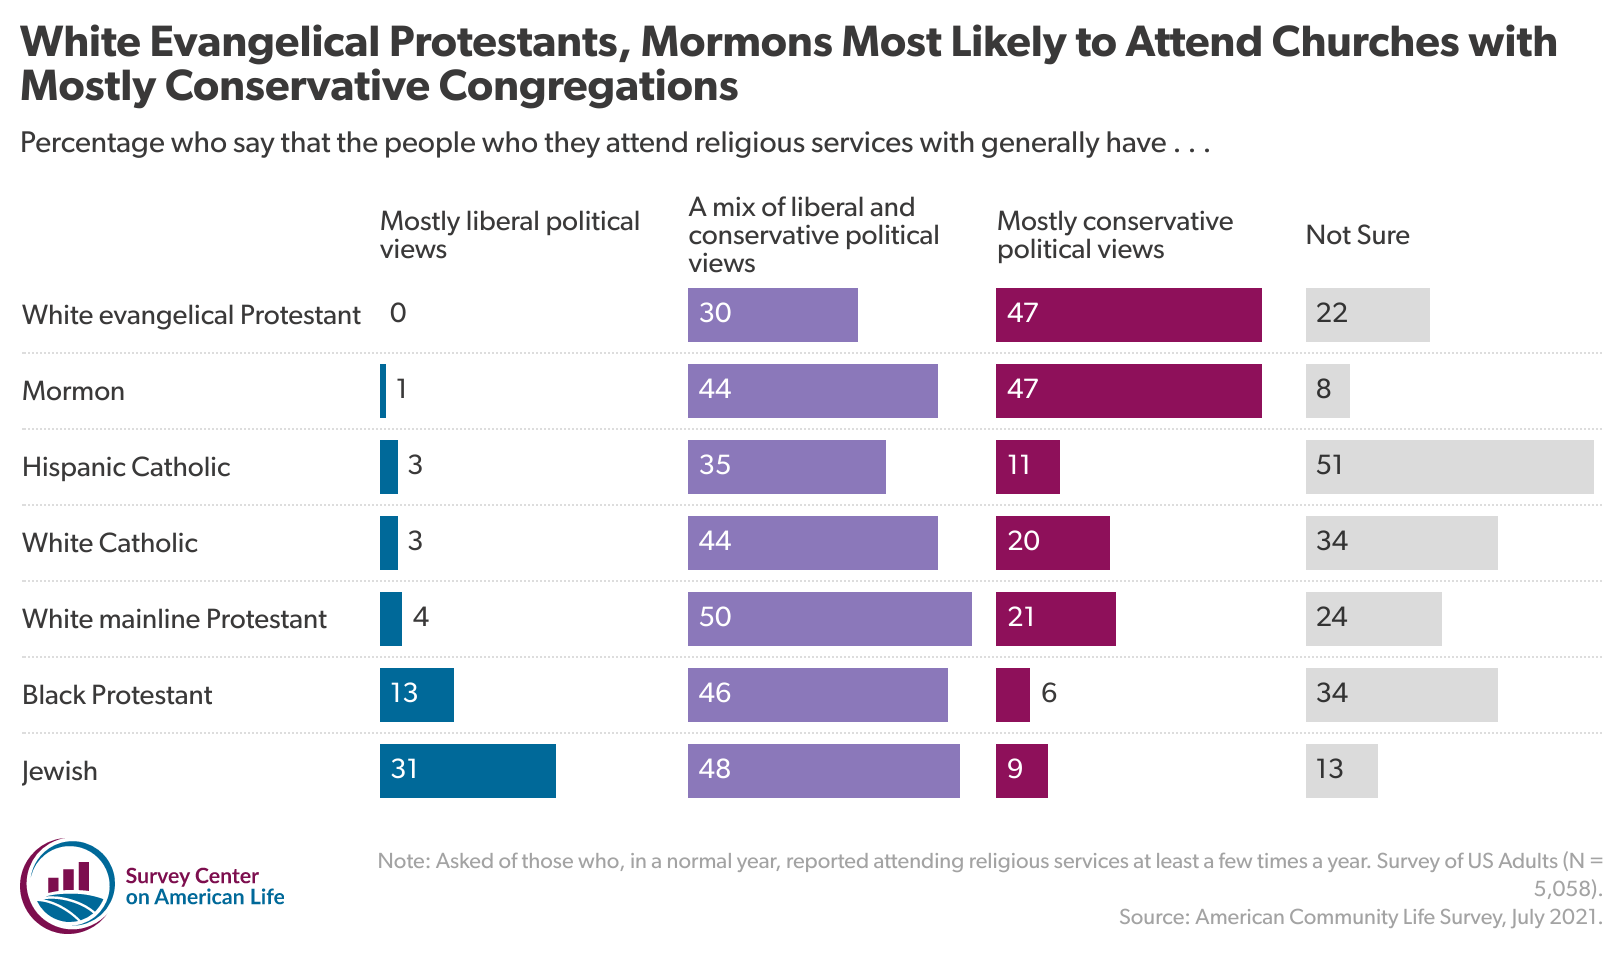
Churches as Political Communities
December 16, 2021
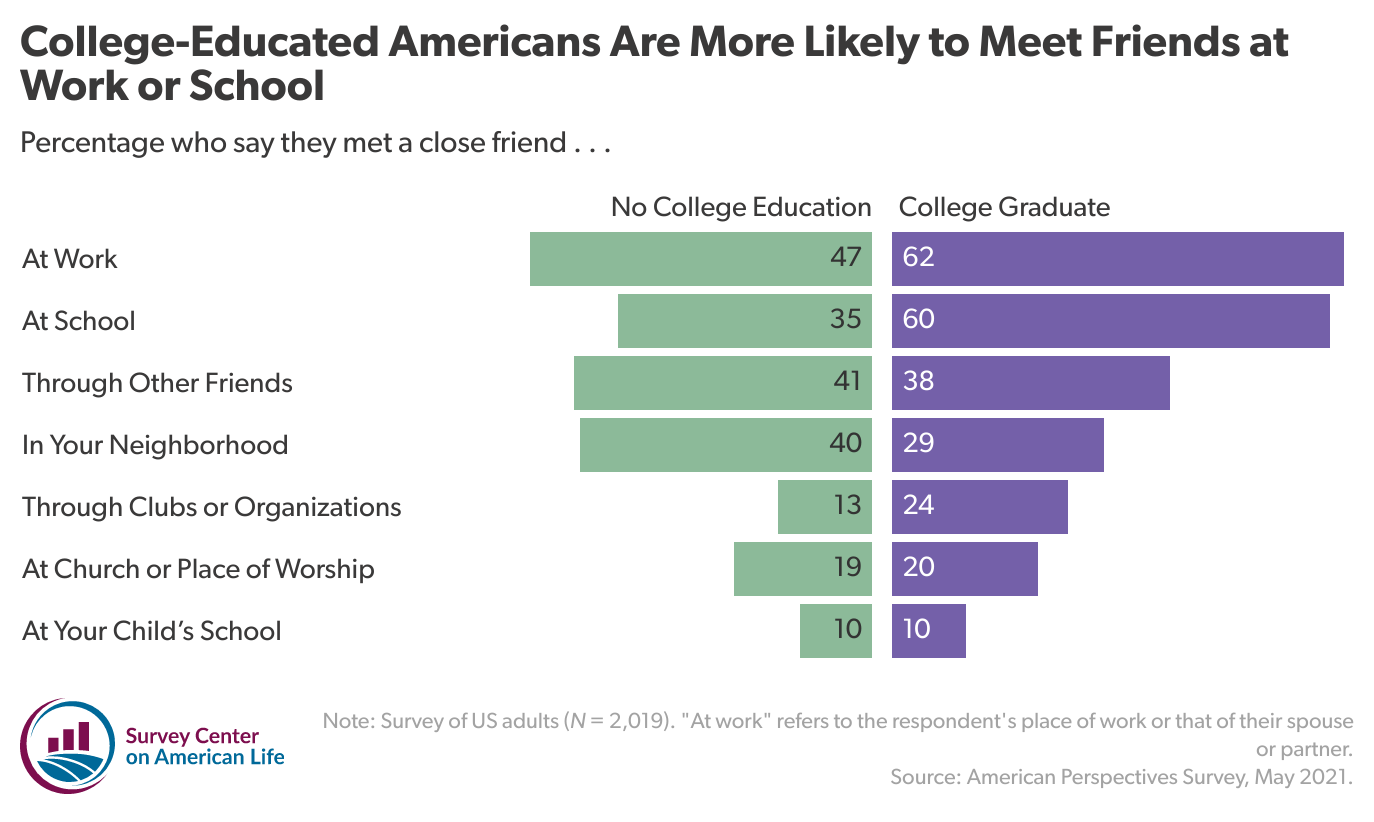
The Importance of Work Friends
December 16, 2021
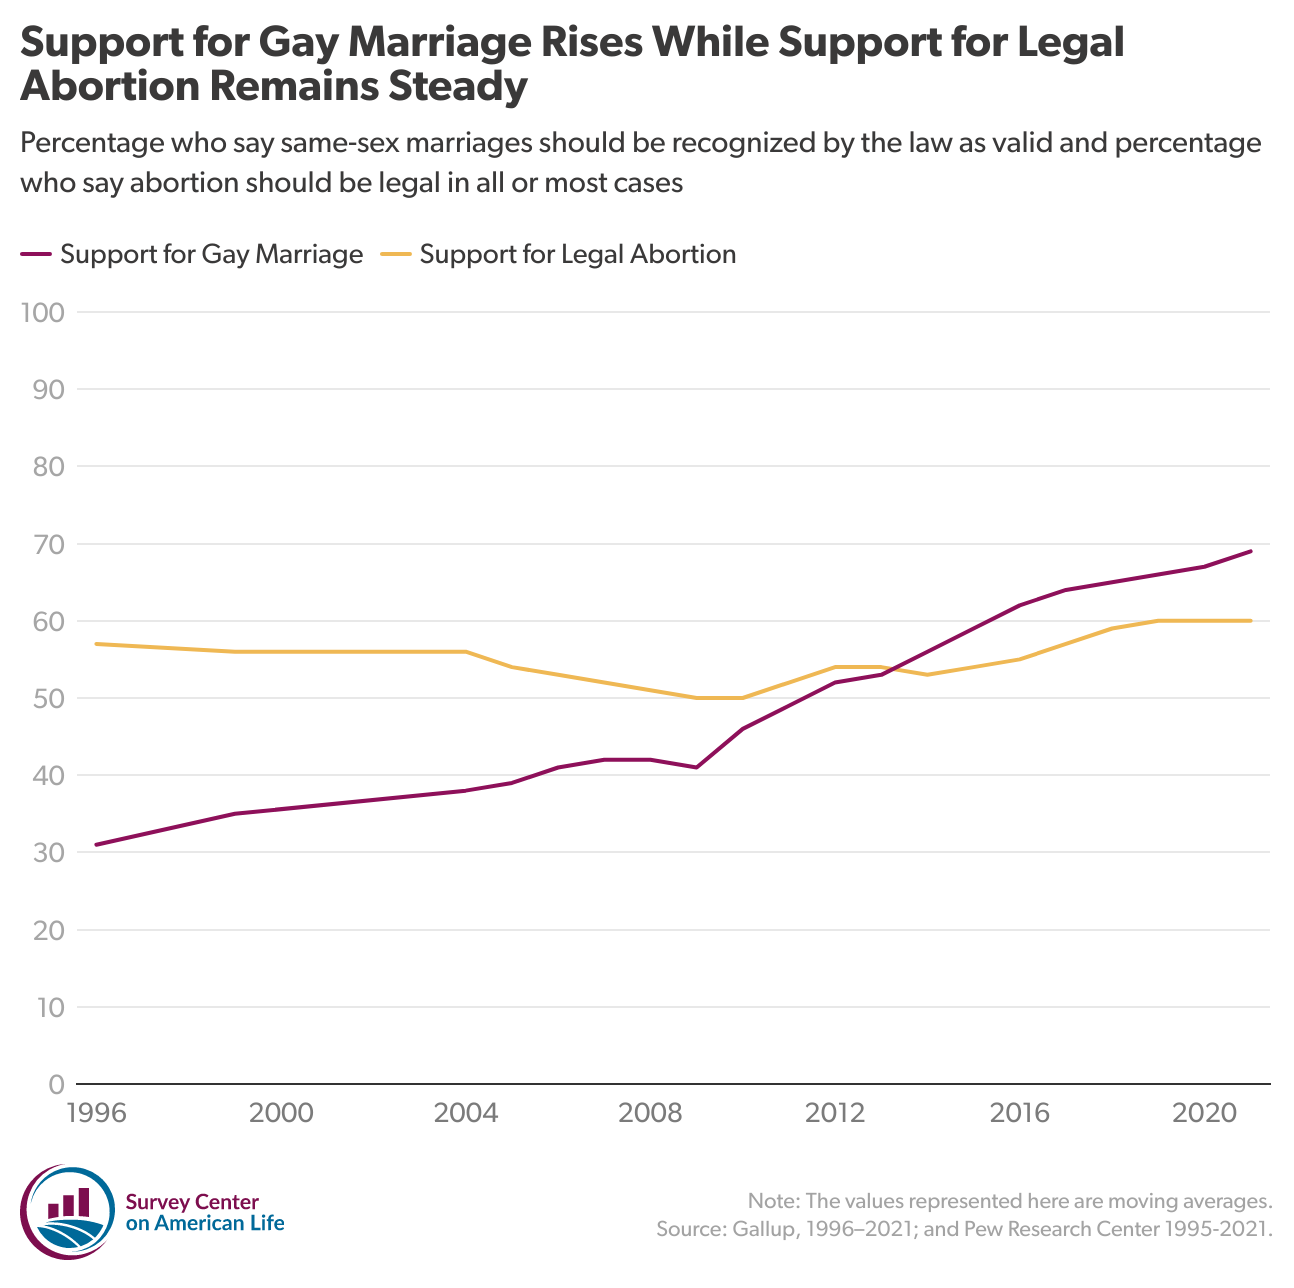
The Diverging Trajectories of Same-Sex Marriage & Abortion
December 16, 2021
A Belief and Belonging Paradox?